
Search for Indicators
Access to Health Services Dashboard
Improving Access to and Capacity to Deliver Health Care Services
Access to health services directly impacts the overall physical, social, and mental health status of the community. When administered and delivered appropriately and in a timely fashion, health services - including primary, behavioral, and specialty care services - help prevent disease and disability, detect and treat health conditions, improve quality of life, avoid preventable death, and increase general life expectancy.
| See all focus areas |
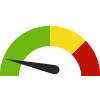
Indicator Gauge Icon Legend
Legend Colors
Red is bad, green is good, blue is not statistically different/neutral.
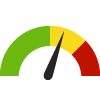
Compared to Distribution
 the value is in the best half of communities.
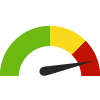
 the value is in the 2nd worst quarter of communities.
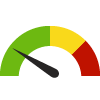
 the value is in the worst quarter of communities.
Compared to Target
 meets target;
  does not meet target.
Compared to a Single Value
 lower than the comparison value;
 higher than the comparison value;
 not statistically different from comparison value.
Trend

 non-significant change over time;
 significant change over time;
  no change over time.
Compared to Prior Value
 higher than the previous measurement period;
 lower than the previous measurement period;
 no statistically different change from previous measurement period.
Health / Health Care Access & Quality
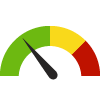
Adults who Visited a Dentist Census Tract: 06017030807
Adults who Visited a Dentist Census Tract: 06017030807
74.3%
(2020)
Compared to:
CA Census Tracts
The distribution is based on data from 8,005 California census tracts.
U.S. Census Tracts
The distribution is based on data from 72,332 U.S. census tracts.
El Dorado, CA County Value
(71.3%)
The regional value is compared to the El Dorado County value.
US Value
(64.8%)
The regional value is compared to the national value.
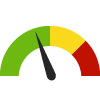
Adults who Visited a Dentist Census Tract: 06017030808
Adults who Visited a Dentist Census Tract: 06017030808
73.4%
(2020)
Compared to:
CA Census Tracts
The distribution is based on data from 8,005 California census tracts.
U.S. Census Tracts
The distribution is based on data from 72,332 U.S. census tracts.
El Dorado, CA County Value
(71.3%)
The regional value is compared to the El Dorado County value.
US Value
(64.8%)
The regional value is compared to the national value.
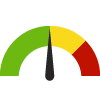
Adults who Visited a Dentist Census Tract: 06017030809
Adults who Visited a Dentist Census Tract: 06017030809
69.9%
(2020)
Compared to:

CA Census Tracts
The distribution is based on data from 8,005 California census tracts.
U.S. Census Tracts
The distribution is based on data from 72,332 U.S. census tracts.
El Dorado, CA County Value
(71.3%)
The regional value is compared to the El Dorado County value.
US Value
(64.8%)
The regional value is compared to the national value.
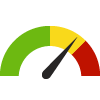
Adults who Visited a Dentist Census Tract: 06017030810
Adults who Visited a Dentist Census Tract: 06017030810
68.2%
(2020)
Compared to:
CA Census Tracts
The distribution is based on data from 8,005 California census tracts.
U.S. Census Tracts
The distribution is based on data from 72,332 U.S. census tracts.
El Dorado, CA County Value
(71.3%)
The regional value is compared to the El Dorado County value.
US Value
(64.8%)
The regional value is compared to the national value.
Adults who Visited a Dentist Census Tract: 06017030901
Adults who Visited a Dentist Census Tract: 06017030901
73.5%
(2020)
Compared to:
CA Census Tracts
The distribution is based on data from 8,005 California census tracts.
U.S. Census Tracts
The distribution is based on data from 72,332 U.S. census tracts.
El Dorado, CA County Value
(71.3%)
The regional value is compared to the El Dorado County value.
US Value
(64.8%)
The regional value is compared to the national value.
Adults who Visited a Dentist Census Tract: 06017030902
Adults who Visited a Dentist Census Tract: 06017030902
75.0%
(2020)
Compared to:
CA Census Tracts
The distribution is based on data from 8,005 California census tracts.
U.S. Census Tracts
The distribution is based on data from 72,332 U.S. census tracts.
El Dorado, CA County Value
(71.3%)
The regional value is compared to the El Dorado County value.
US Value
(64.8%)
The regional value is compared to the national value.
Adults who Visited a Dentist Census Tract: 06017031000
Adults who Visited a Dentist Census Tract: 06017031000
68.4%
(2020)
Compared to:
CA Census Tracts
The distribution is based on data from 8,005 California census tracts.
U.S. Census Tracts
The distribution is based on data from 72,332 U.S. census tracts.
El Dorado, CA County Value
(71.3%)
The regional value is compared to the El Dorado County value.
US Value
(64.8%)
The regional value is compared to the national value.
Adults who Visited a Dentist Census Tract: 06017031100
Adults who Visited a Dentist Census Tract: 06017031100
66.2%
(2020)
Compared to:
CA Census Tracts
The distribution is based on data from 8,005 California census tracts.
U.S. Census Tracts
The distribution is based on data from 72,332 U.S. census tracts.
El Dorado, CA County Value
(71.3%)
The regional value is compared to the El Dorado County value.
US Value
(64.8%)
The regional value is compared to the national value.
Adults who Visited a Dentist Census Tract: 06017031200
Adults who Visited a Dentist Census Tract: 06017031200
69.6%
(2020)
Compared to:
CA Census Tracts
The distribution is based on data from 8,005 California census tracts.
U.S. Census Tracts
The distribution is based on data from 72,332 U.S. census tracts.
El Dorado, CA County Value
(71.3%)
The regional value is compared to the El Dorado County value.
US Value
(64.8%)
The regional value is compared to the national value.
Adults who Visited a Dentist Census Tract: 06017031301
Adults who Visited a Dentist Census Tract: 06017031301
70.1%
(2020)
Compared to:
CA Census Tracts
The distribution is based on data from 8,005 California census tracts.
U.S. Census Tracts
The distribution is based on data from 72,332 U.S. census tracts.
El Dorado, CA County Value
(71.3%)
The regional value is compared to the El Dorado County value.
US Value
(64.8%)
The regional value is compared to the national value.
Adults who Visited a Dentist Census Tract: 06017031302
Adults who Visited a Dentist Census Tract: 06017031302
62.9%
(2020)
Compared to:
CA Census Tracts
The distribution is based on data from 8,005 California census tracts.
U.S. Census Tracts
The distribution is based on data from 72,332 U.S. census tracts.
El Dorado, CA County Value
(71.3%)
The regional value is compared to the El Dorado County value.
US Value
(64.8%)
The regional value is compared to the national value.
Adults who Visited a Dentist Census Tract: 06017031402
Adults who Visited a Dentist Census Tract: 06017031402
68.6%
(2020)
Compared to:
CA Census Tracts
The distribution is based on data from 8,005 California census tracts.
U.S. Census Tracts
The distribution is based on data from 72,332 U.S. census tracts.
El Dorado, CA County Value
(71.3%)
The regional value is compared to the El Dorado County value.
US Value
(64.8%)
The regional value is compared to the national value.
Adults who Visited a Dentist Census Tract: 06017031404
Adults who Visited a Dentist Census Tract: 06017031404
72.8%
(2020)
Compared to:
CA Census Tracts
The distribution is based on data from 8,005 California census tracts.
U.S. Census Tracts
The distribution is based on data from 72,332 U.S. census tracts.
El Dorado, CA County Value
(71.3%)
The regional value is compared to the El Dorado County value.
US Value
(64.8%)
The regional value is compared to the national value.
Adults who Visited a Dentist Census Tract: 06017031405
Adults who Visited a Dentist Census Tract: 06017031405
73.8%
(2020)
Compared to:
CA Census Tracts
The distribution is based on data from 8,005 California census tracts.
U.S. Census Tracts
The distribution is based on data from 72,332 U.S. census tracts.
El Dorado, CA County Value
(71.3%)
The regional value is compared to the El Dorado County value.
US Value
(64.8%)
The regional value is compared to the national value.
Adults who Visited a Dentist Census Tract: 06017031406
Adults who Visited a Dentist Census Tract: 06017031406
71.2%
(2020)
Compared to:
CA Census Tracts
The distribution is based on data from 8,005 California census tracts.
U.S. Census Tracts
The distribution is based on data from 72,332 U.S. census tracts.
El Dorado, CA County Value
(71.3%)
The regional value is compared to the El Dorado County value.
US Value
(64.8%)
The regional value is compared to the national value.
Adults who Visited a Dentist Census Tract: 06017031502
Adults who Visited a Dentist Census Tract: 06017031502
69.3%
(2020)
Compared to:
CA Census Tracts
The distribution is based on data from 8,005 California census tracts.
U.S. Census Tracts
The distribution is based on data from 72,332 U.S. census tracts.
El Dorado, CA County Value
(71.3%)
The regional value is compared to the El Dorado County value.
US Value
(64.8%)
The regional value is compared to the national value.
Adults who Visited a Dentist Census Tract: 06017031503
Adults who Visited a Dentist Census Tract: 06017031503
73.3%
(2020)
Compared to:
CA Census Tracts
The distribution is based on data from 8,005 California census tracts.
U.S. Census Tracts
The distribution is based on data from 72,332 U.S. census tracts.
El Dorado, CA County Value
(71.3%)
The regional value is compared to the El Dorado County value.
US Value
(64.8%)
The regional value is compared to the national value.
Adults who Visited a Dentist Census Tract: 06017031504
Adults who Visited a Dentist Census Tract: 06017031504
69.3%
(2020)
Compared to:
CA Census Tracts
The distribution is based on data from 8,005 California census tracts.
U.S. Census Tracts
The distribution is based on data from 72,332 U.S. census tracts.
El Dorado, CA County Value
(71.3%)
The regional value is compared to the El Dorado County value.
US Value
(64.8%)
The regional value is compared to the national value.
Adults who Visited a Dentist Census Tract: 06017031600
Adults who Visited a Dentist Census Tract: 06017031600
58.5%
(2020)
Compared to:
CA Census Tracts
The distribution is based on data from 8,005 California census tracts.
U.S. Census Tracts
The distribution is based on data from 72,332 U.S. census tracts.
El Dorado, CA County Value
(71.3%)
The regional value is compared to the El Dorado County value.
US Value
(64.8%)
The regional value is compared to the national value.
Adults who Visited a Dentist Census Tract: 06017031700
Adults who Visited a Dentist Census Tract: 06017031700
78.2%
(2020)
Compared to:
CA Census Tracts
The distribution is based on data from 8,005 California census tracts.
U.S. Census Tracts
The distribution is based on data from 72,332 U.S. census tracts.
El Dorado, CA County Value
(71.3%)
The regional value is compared to the El Dorado County value.
US Value
(64.8%)
The regional value is compared to the national value.
Adults who Visited a Dentist Census Tract: 06017031800
Adults who Visited a Dentist Census Tract: 06017031800
77.4%
(2020)
Compared to:
CA Census Tracts
The distribution is based on data from 8,005 California census tracts.
U.S. Census Tracts
The distribution is based on data from 72,332 U.S. census tracts.
El Dorado, CA County Value
(71.3%)
The regional value is compared to the El Dorado County value.
US Value
(64.8%)
The regional value is compared to the national value.
Adults who Visited a Dentist Census Tract: 06017031900
Adults who Visited a Dentist Census Tract: 06017031900
71.1%
(2020)
Compared to:
CA Census Tracts
The distribution is based on data from 8,005 California census tracts.
U.S. Census Tracts
The distribution is based on data from 72,332 U.S. census tracts.
El Dorado, CA County Value
(71.3%)
The regional value is compared to the El Dorado County value.
US Value
(64.8%)
The regional value is compared to the national value.
Adults who Visited a Dentist Census Tract: 06017032000
Adults who Visited a Dentist Census Tract: 06017032000
70.6%
(2020)
Compared to:
CA Census Tracts
The distribution is based on data from 8,005 California census tracts.
U.S. Census Tracts
The distribution is based on data from 72,332 U.S. census tracts.
El Dorado, CA County Value
(71.3%)
The regional value is compared to the El Dorado County value.
US Value
(64.8%)
The regional value is compared to the national value.
Adults without Health Insurance County: El Dorado
Adults without Health Insurance County: El Dorado
5.9%
(2021)
Compared to:
CA Counties
The distribution is based on data from 58 California counties.
U.S. Counties
The distribution is based on data from 3,074 U.S. counties and county equivalents.
US Value
(10.8%)
The regional value is compared to the national value.
Adults without Health Insurance Census Place: Auburn Lake Trails
Adults without Health Insurance Census Place: Auburn Lake Trails
4.5%
(2021)
Compared to:
CA Census Places
The distribution is based on data from 1,472 locales.
U.S. Census Places
The distribution is based on data from 27,528 U.S. Census Places.
El Dorado, CA County Value
(5.9%)
The regional value is compared to the El Dorado County value.
US Value
(10.8%)
The regional value is compared to the national value.
Adults without Health Insurance Census Place: Cameron Park
Adults without Health Insurance Census Place: Cameron Park
5.7%
(2021)
Compared to:
CA Census Places
The distribution is based on data from 1,472 locales.
U.S. Census Places
The distribution is based on data from 27,528 U.S. Census Places.
El Dorado, CA County Value
(5.9%)
The regional value is compared to the El Dorado County value.
US Value
(10.8%)
The regional value is compared to the national value.
Adults without Health Insurance Census Place: Camino
Adults without Health Insurance Census Place: Camino
6.2%
(2021)
Compared to:

CA Census Places
The distribution is based on data from 1,472 locales.
U.S. Census Places
The distribution is based on data from 27,528 U.S. Census Places.
El Dorado, CA County Value
(5.9%)
The regional value is compared to the El Dorado County value.
US Value
(10.8%)
The regional value is compared to the national value.
Adults without Health Insurance Census Place: Cold Springs
Adults without Health Insurance Census Place: Cold Springs
4.9%
(2021)
Compared to:
CA Census Places
The distribution is based on data from 1,472 locales.
U.S. Census Places
The distribution is based on data from 27,528 U.S. Census Places.
El Dorado, CA County Value
(5.9%)
The regional value is compared to the El Dorado County value.
US Value
(10.8%)
The regional value is compared to the national value.
Adults without Health Insurance Census Place: Coloma
Adults without Health Insurance Census Place: Coloma
6.2%
(2021)
Compared to:
CA Census Places
The distribution is based on data from 1,472 locales.
U.S. Census Places
The distribution is based on data from 27,528 U.S. Census Places.
El Dorado, CA County Value
(5.9%)
The regional value is compared to the El Dorado County value.
US Value
(10.8%)
The regional value is compared to the national value.
Adults without Health Insurance Census Place: Diamond Springs
Adults without Health Insurance Census Place: Diamond Springs
6.4%
(2021)
Compared to:
CA Census Places
The distribution is based on data from 1,472 locales.
U.S. Census Places
The distribution is based on data from 27,528 U.S. Census Places.
El Dorado, CA County Value
(5.9%)
The regional value is compared to the El Dorado County value.
US Value
(10.8%)
The regional value is compared to the national value.
Adults without Health Insurance Census Place: El Dorado Hills
Adults without Health Insurance Census Place: El Dorado Hills
4.2%
(2021)
Compared to:
CA Census Places
The distribution is based on data from 1,472 locales.
U.S. Census Places
The distribution is based on data from 27,528 U.S. Census Places.
El Dorado, CA County Value
(5.9%)
The regional value is compared to the El Dorado County value.
US Value
(10.8%)
The regional value is compared to the national value.
Adults without Health Insurance Census Place: Georgetown
Adults without Health Insurance Census Place: Georgetown
7.0%
(2021)
Compared to:
CA Census Places
The distribution is based on data from 1,472 locales.
U.S. Census Places
The distribution is based on data from 27,528 U.S. Census Places.
El Dorado, CA County Value
(5.9%)
The regional value is compared to the El Dorado County value.
US Value
(10.8%)
The regional value is compared to the national value.
Adults without Health Insurance Census Place: Grizzly Flats
Adults without Health Insurance Census Place: Grizzly Flats
5.8%
(2021)
Compared to:
CA Census Places
The distribution is based on data from 1,472 locales.
U.S. Census Places
The distribution is based on data from 27,528 U.S. Census Places.
El Dorado, CA County Value
(5.9%)
The regional value is compared to the El Dorado County value.
US Value
(10.8%)
The regional value is compared to the national value.
Adults without Health Insurance Census Place: Placerville
Adults without Health Insurance Census Place: Placerville
7.7%
(2021)
Compared to:
CA Census Places
The distribution is based on data from 1,472 locales.
U.S. Census Places
The distribution is based on data from 27,528 U.S. Census Places.
El Dorado, CA County Value
(5.9%)
The regional value is compared to the El Dorado County value.
US Value
(10.8%)
The regional value is compared to the national value.
Adults without Health Insurance Census Place: Pollock Pines
Adults without Health Insurance Census Place: Pollock Pines
6.8%
(2021)
Compared to:
CA Census Places
The distribution is based on data from 1,472 locales.
U.S. Census Places
The distribution is based on data from 27,528 U.S. Census Places.
El Dorado, CA County Value
(5.9%)
The regional value is compared to the El Dorado County value.
US Value
(10.8%)
The regional value is compared to the national value.
Adults without Health Insurance Census Place: Shingle Springs
Adults without Health Insurance Census Place: Shingle Springs
5.3%
(2021)
Compared to:
CA Census Places
The distribution is based on data from 1,472 locales.
U.S. Census Places
The distribution is based on data from 27,528 U.S. Census Places.
El Dorado, CA County Value
(5.9%)
The regional value is compared to the El Dorado County value.
US Value
(10.8%)
The regional value is compared to the national value.
Adults without Health Insurance Census Place: South Lake Tahoe
Adults without Health Insurance Census Place: South Lake Tahoe
10.2%
(2021)
Compared to:
CA Census Places
The distribution is based on data from 1,472 locales.
U.S. Census Places
The distribution is based on data from 27,528 U.S. Census Places.
El Dorado, CA County Value
(5.9%)
The regional value is compared to the El Dorado County value.
US Value
(10.8%)
The regional value is compared to the national value.
Adults without Health Insurance Census Place: Tahoma
Adults without Health Insurance Census Place: Tahoma
5.6%
(2021)
Compared to:
CA Census Places
The distribution is based on data from 1,472 locales.
U.S. Census Places
The distribution is based on data from 27,528 U.S. Census Places.
El Dorado, CA County Value
(5.9%)
The regional value is compared to the El Dorado County value.
US Value
(10.8%)
The regional value is compared to the national value.
Adults without Health Insurance Zip Code: 95614
Adults without Health Insurance Zip Code: 95614
4.5%
(2021)
Compared to:
CA Zip Codes
The distribution is based on data from 1,730 California zip codes.
U.S. Zip Codes
The distribution is based on data from 31,435 U.S. zip codes.
El Dorado, CA County Value
(5.9%)
The regional value is compared to the El Dorado County value.
US Value
(10.8%)
The regional value is compared to the national value.
Adults without Health Insurance Zip Code: 95619
Adults without Health Insurance Zip Code: 95619
7.1%
(2021)
Compared to:
CA Zip Codes
The distribution is based on data from 1,730 California zip codes.
U.S. Zip Codes
The distribution is based on data from 31,435 U.S. zip codes.
El Dorado, CA County Value
(5.9%)
The regional value is compared to the El Dorado County value.
US Value
(10.8%)
The regional value is compared to the national value.
Adults without Health Insurance Zip Code: 95623
Adults without Health Insurance Zip Code: 95623
5.2%
(2021)
Compared to:
CA Zip Codes
The distribution is based on data from 1,730 California zip codes.
U.S. Zip Codes
The distribution is based on data from 31,435 U.S. zip codes.
El Dorado, CA County Value
(5.9%)
The regional value is compared to the El Dorado County value.
US Value
(10.8%)
The regional value is compared to the national value.
Adults without Health Insurance Zip Code: 95633
Adults without Health Insurance Zip Code: 95633
6.5%
(2021)
Compared to:
CA Zip Codes
The distribution is based on data from 1,730 California zip codes.
U.S. Zip Codes
The distribution is based on data from 31,435 U.S. zip codes.
El Dorado, CA County Value
(5.9%)
The regional value is compared to the El Dorado County value.
US Value
(10.8%)
The regional value is compared to the national value.
Adults without Health Insurance Zip Code: 95634
Adults without Health Insurance Zip Code: 95634
6.8%
(2021)
Compared to:
CA Zip Codes
The distribution is based on data from 1,730 California zip codes.
U.S. Zip Codes
The distribution is based on data from 31,435 U.S. zip codes.
El Dorado, CA County Value
(5.9%)
The regional value is compared to the El Dorado County value.
US Value
(10.8%)
The regional value is compared to the national value.
Adults without Health Insurance Zip Code: 95635
Adults without Health Insurance Zip Code: 95635
6.9%
(2021)
Compared to:
CA Zip Codes
The distribution is based on data from 1,730 California zip codes.
U.S. Zip Codes
The distribution is based on data from 31,435 U.S. zip codes.
El Dorado, CA County Value
(5.9%)
The regional value is compared to the El Dorado County value.
US Value
(10.8%)
The regional value is compared to the national value.
Adults without Health Insurance Zip Code: 95636
Adults without Health Insurance Zip Code: 95636
5.9%
(2021)
Compared to:
CA Zip Codes
The distribution is based on data from 1,730 California zip codes.
U.S. Zip Codes
The distribution is based on data from 31,435 U.S. zip codes.
El Dorado, CA County Value
(5.9%)
The regional value is compared to the El Dorado County value.
US Value
(10.8%)
The regional value is compared to the national value.
Adults without Health Insurance Zip Code: 95651
Adults without Health Insurance Zip Code: 95651
5.4%
(2021)
Compared to:
CA Zip Codes
The distribution is based on data from 1,730 California zip codes.
U.S. Zip Codes
The distribution is based on data from 31,435 U.S. zip codes.
El Dorado, CA County Value
(5.9%)
The regional value is compared to the El Dorado County value.
US Value
(10.8%)
The regional value is compared to the national value.
Adults without Health Insurance Zip Code: 95664
Adults without Health Insurance Zip Code: 95664
4.5%
(2021)
Compared to:
CA Zip Codes
The distribution is based on data from 1,730 California zip codes.
U.S. Zip Codes
The distribution is based on data from 31,435 U.S. zip codes.
El Dorado, CA County Value
(5.9%)
The regional value is compared to the El Dorado County value.
US Value
(10.8%)
The regional value is compared to the national value.
Adults without Health Insurance Zip Code: 95667
Adults without Health Insurance Zip Code: 95667
6.1%
(2021)
Compared to:
CA Zip Codes
The distribution is based on data from 1,730 California zip codes.
U.S. Zip Codes
The distribution is based on data from 31,435 U.S. zip codes.
El Dorado, CA County Value
(5.9%)
The regional value is compared to the El Dorado County value.
US Value
(10.8%)
The regional value is compared to the national value.
Adults without Health Insurance Zip Code: 95672
Adults without Health Insurance Zip Code: 95672
4.6%
(2021)
Compared to:
CA Zip Codes
The distribution is based on data from 1,730 California zip codes.
U.S. Zip Codes
The distribution is based on data from 31,435 U.S. zip codes.
El Dorado, CA County Value
(5.9%)
The regional value is compared to the El Dorado County value.
US Value
(10.8%)
The regional value is compared to the national value.
Adults without Health Insurance Zip Code: 95682
Adults without Health Insurance Zip Code: 95682
5.4%
(2021)
Compared to:
CA Zip Codes
The distribution is based on data from 1,730 California zip codes.
U.S. Zip Codes
The distribution is based on data from 31,435 U.S. zip codes.
El Dorado, CA County Value
(5.9%)
The regional value is compared to the El Dorado County value.
US Value
(10.8%)
The regional value is compared to the national value.
Adults without Health Insurance Zip Code: 95684
Adults without Health Insurance Zip Code: 95684
5.6%
(2021)
Compared to:
CA Zip Codes
The distribution is based on data from 1,730 California zip codes.
U.S. Zip Codes
The distribution is based on data from 31,435 U.S. zip codes.
El Dorado, CA County Value
(5.9%)
The regional value is compared to the El Dorado County value.
US Value
(10.8%)
The regional value is compared to the national value.
Adults without Health Insurance Zip Code: 95709
Adults without Health Insurance Zip Code: 95709
6.6%
(2021)
Compared to:
CA Zip Codes
The distribution is based on data from 1,730 California zip codes.
U.S. Zip Codes
The distribution is based on data from 31,435 U.S. zip codes.
El Dorado, CA County Value
(5.9%)
The regional value is compared to the El Dorado County value.
US Value
(10.8%)
The regional value is compared to the national value.
Adults without Health Insurance Zip Code: 95720
Adults without Health Insurance Zip Code: 95720
5.5%
(2021)
Compared to:
CA Zip Codes
The distribution is based on data from 1,730 California zip codes.
U.S. Zip Codes
The distribution is based on data from 31,435 U.S. zip codes.
El Dorado, CA County Value
(5.9%)
The regional value is compared to the El Dorado County value.
US Value
(10.8%)
The regional value is compared to the national value.
Adults without Health Insurance Zip Code: 95726
Adults without Health Insurance Zip Code: 95726
6.0%
(2021)
Compared to:
CA Zip Codes
The distribution is based on data from 1,730 California zip codes.
U.S. Zip Codes
The distribution is based on data from 31,435 U.S. zip codes.
El Dorado, CA County Value
(5.9%)
The regional value is compared to the El Dorado County value.
US Value
(10.8%)
The regional value is compared to the national value.
Adults without Health Insurance Zip Code: 95735
Adults without Health Insurance Zip Code: 95735
5.3%
(2021)
Compared to:
CA Zip Codes
The distribution is based on data from 1,730 California zip codes.
U.S. Zip Codes
The distribution is based on data from 31,435 U.S. zip codes.
El Dorado, CA County Value
(5.9%)
The regional value is compared to the El Dorado County value.
US Value
(10.8%)
The regional value is compared to the national value.
Adults without Health Insurance Zip Code: 95762
Adults without Health Insurance Zip Code: 95762
4.1%
(2021)
Compared to:
CA Zip Codes
The distribution is based on data from 1,730 California zip codes.
U.S. Zip Codes
The distribution is based on data from 31,435 U.S. zip codes.
El Dorado, CA County Value
(5.9%)
The regional value is compared to the El Dorado County value.
US Value
(10.8%)
The regional value is compared to the national value.
Adults without Health Insurance Zip Code: 96142
Adults without Health Insurance Zip Code: 96142
5.4%
(2021)
Compared to:
CA Zip Codes
The distribution is based on data from 1,730 California zip codes.
U.S. Zip Codes
The distribution is based on data from 31,435 U.S. zip codes.
El Dorado, CA County Value
(5.9%)
The regional value is compared to the El Dorado County value.
US Value
(10.8%)
The regional value is compared to the national value.
Adults without Health Insurance Zip Code: 96150
Adults without Health Insurance Zip Code: 96150
8.5%
(2021)
Compared to:
CA Zip Codes
The distribution is based on data from 1,730 California zip codes.
U.S. Zip Codes
The distribution is based on data from 31,435 U.S. zip codes.
El Dorado, CA County Value
(5.9%)
The regional value is compared to the El Dorado County value.
US Value
(10.8%)
The regional value is compared to the national value.
Adults without Health Insurance Census Tract: 06017030200
Adults without Health Insurance Census Tract: 06017030200
12.9%
(2021)
Compared to:
CA Census Tracts
The distribution is based on data from 8,005 California census tracts.
U.S. Census Tracts
The distribution is based on data from 68,167 U.S. census tracts.
El Dorado, CA County Value
(5.9%)
The regional value is compared to the El Dorado County value.
US Value
(10.8%)
The regional value is compared to the national value.
Adults without Health Insurance Census Tract: 06017030301
Adults without Health Insurance Census Tract: 06017030301
10.4%
(2021)
Compared to:
CA Census Tracts
The distribution is based on data from 8,005 California census tracts.
U.S. Census Tracts
The distribution is based on data from 68,167 U.S. census tracts.
El Dorado, CA County Value
(5.9%)
The regional value is compared to the El Dorado County value.
US Value
(10.8%)
The regional value is compared to the national value.
Adults without Health Insurance Census Tract: 06017030302
Adults without Health Insurance Census Tract: 06017030302
8.8%
(2021)
Compared to:
CA Census Tracts
The distribution is based on data from 8,005 California census tracts.
U.S. Census Tracts
The distribution is based on data from 68,167 U.S. census tracts.
El Dorado, CA County Value
(5.9%)
The regional value is compared to the El Dorado County value.
US Value
(10.8%)
The regional value is compared to the national value.
Adults without Health Insurance Census Tract: 06017030401
Adults without Health Insurance Census Tract: 06017030401
5.3%
(2021)
Compared to:
CA Census Tracts
The distribution is based on data from 8,005 California census tracts.
U.S. Census Tracts
The distribution is based on data from 68,167 U.S. census tracts.
El Dorado, CA County Value
(5.9%)
The regional value is compared to the El Dorado County value.
US Value
(10.8%)
The regional value is compared to the national value.
Adults without Health Insurance Census Tract: 06017030402
Adults without Health Insurance Census Tract: 06017030402
8.2%
(2021)
Compared to:
CA Census Tracts
The distribution is based on data from 8,005 California census tracts.
U.S. Census Tracts
The distribution is based on data from 68,167 U.S. census tracts.
El Dorado, CA County Value
(5.9%)
The regional value is compared to the El Dorado County value.
US Value
(10.8%)
The regional value is compared to the national value.
Adults without Health Insurance Census Tract: 06017030502
Adults without Health Insurance Census Tract: 06017030502
3.9%
(2021)
Compared to:
CA Census Tracts
The distribution is based on data from 8,005 California census tracts.
U.S. Census Tracts
The distribution is based on data from 68,167 U.S. census tracts.
El Dorado, CA County Value
(5.9%)
The regional value is compared to the El Dorado County value.
US Value
(10.8%)
The regional value is compared to the national value.
Adults without Health Insurance Census Tract: 06017030504
Adults without Health Insurance Census Tract: 06017030504
4.2%
(2021)
Compared to:
CA Census Tracts
The distribution is based on data from 8,005 California census tracts.
U.S. Census Tracts
The distribution is based on data from 68,167 U.S. census tracts.
El Dorado, CA County Value
(5.9%)
The regional value is compared to the El Dorado County value.
US Value
(10.8%)
The regional value is compared to the national value.
Adults without Health Insurance Census Tract: 06017030505
Adults without Health Insurance Census Tract: 06017030505
5.3%
(2021)
Compared to:
CA Census Tracts
The distribution is based on data from 8,005 California census tracts.
U.S. Census Tracts
The distribution is based on data from 68,167 U.S. census tracts.
El Dorado, CA County Value
(5.9%)
The regional value is compared to the El Dorado County value.
US Value
(10.8%)
The regional value is compared to the national value.
Adults without Health Insurance Census Tract: 06017030601
Adults without Health Insurance Census Tract: 06017030601
4.5%
(2021)
Compared to:
CA Census Tracts
The distribution is based on data from 8,005 California census tracts.
U.S. Census Tracts
The distribution is based on data from 68,167 U.S. census tracts.
El Dorado, CA County Value
(5.9%)
The regional value is compared to the El Dorado County value.
US Value
(10.8%)
The regional value is compared to the national value.
Adults without Health Insurance Census Tract: 06017030602
Adults without Health Insurance Census Tract: 06017030602
6.8%
(2021)
Compared to:
CA Census Tracts
The distribution is based on data from 8,005 California census tracts.
U.S. Census Tracts
The distribution is based on data from 68,167 U.S. census tracts.
El Dorado, CA County Value
(5.9%)
The regional value is compared to the El Dorado County value.
US Value
(10.8%)
The regional value is compared to the national value.
Adults without Health Insurance Census Tract: 06017030603
Adults without Health Insurance Census Tract: 06017030603
6.1%
(2021)
Compared to:
CA Census Tracts
The distribution is based on data from 8,005 California census tracts.
U.S. Census Tracts
The distribution is based on data from 68,167 U.S. census tracts.
El Dorado, CA County Value
(5.9%)
The regional value is compared to the El Dorado County value.
US Value
(10.8%)
The regional value is compared to the national value.
Adults without Health Insurance Census Tract: 06017030701
Adults without Health Insurance Census Tract: 06017030701
4.1%
(2021)
Compared to:
CA Census Tracts
The distribution is based on data from 8,005 California census tracts.
U.S. Census Tracts
The distribution is based on data from 68,167 U.S. census tracts.
El Dorado, CA County Value
(5.9%)
The regional value is compared to the El Dorado County value.
US Value
(10.8%)
The regional value is compared to the national value.
Adults without Health Insurance Census Tract: 06017030704
Adults without Health Insurance Census Tract: 06017030704
5.1%
(2021)
Compared to:
CA Census Tracts
The distribution is based on data from 8,005 California census tracts.
U.S. Census Tracts
The distribution is based on data from 68,167 U.S. census tracts.
El Dorado, CA County Value
(5.9%)
The regional value is compared to the El Dorado County value.
US Value
(10.8%)
The regional value is compared to the national value.
Adults without Health Insurance Census Tract: 06017030706
Adults without Health Insurance Census Tract: 06017030706
4.2%
(2021)
Compared to:
CA Census Tracts
The distribution is based on data from 8,005 California census tracts.
U.S. Census Tracts
The distribution is based on data from 68,167 U.S. census tracts.
El Dorado, CA County Value
(5.9%)
The regional value is compared to the El Dorado County value.
US Value
(10.8%)
The regional value is compared to the national value.
Adults without Health Insurance Census Tract: 06017030709
Adults without Health Insurance Census Tract: 06017030709
3.5%
(2021)
Compared to:
CA Census Tracts
The distribution is based on data from 8,005 California census tracts.
U.S. Census Tracts
The distribution is based on data from 68,167 U.S. census tracts.
El Dorado, CA County Value
(5.9%)
The regional value is compared to the El Dorado County value.
US Value
(10.8%)
The regional value is compared to the national value.
Adults without Health Insurance Census Tract: 06017030710
Adults without Health Insurance Census Tract: 06017030710
3.5%
(2021)
Compared to:
CA Census Tracts
The distribution is based on data from 8,005 California census tracts.
U.S. Census Tracts
The distribution is based on data from 68,167 U.S. census tracts.
El Dorado, CA County Value
(5.9%)
The regional value is compared to the El Dorado County value.
US Value
(10.8%)
The regional value is compared to the national value.
Adults without Health Insurance Census Tract: 06017030801
Adults without Health Insurance Census Tract: 06017030801
4.9%
(2021)
Compared to:
CA Census Tracts
The distribution is based on data from 8,005 California census tracts.
U.S. Census Tracts
The distribution is based on data from 68,167 U.S. census tracts.
El Dorado, CA County Value
(5.9%)
The regional value is compared to the El Dorado County value.
US Value
(10.8%)
The regional value is compared to the national value.
Adults without Health Insurance Census Tract: 06017030803
Adults without Health Insurance Census Tract: 06017030803
5.2%
(2021)
Compared to:
CA Census Tracts
The distribution is based on data from 8,005 California census tracts.
U.S. Census Tracts
The distribution is based on data from 68,167 U.S. census tracts.
El Dorado, CA County Value
(5.9%)
The regional value is compared to the El Dorado County value.
US Value
(10.8%)
The regional value is compared to the national value.
Adults without Health Insurance Census Tract: 06017030804
Adults without Health Insurance Census Tract: 06017030804
5.2%
(2021)
Compared to:
CA Census Tracts
The distribution is based on data from 8,005 California census tracts.
U.S. Census Tracts
The distribution is based on data from 68,167 U.S. census tracts.
El Dorado, CA County Value
(5.9%)
The regional value is compared to the El Dorado County value.
US Value
(10.8%)
The regional value is compared to the national value.
Adults without Health Insurance Census Tract: 06017030807
Adults without Health Insurance Census Tract: 06017030807
4.8%
(2021)
Compared to:
CA Census Tracts
The distribution is based on data from 8,005 California census tracts.
U.S. Census Tracts
The distribution is based on data from 68,167 U.S. census tracts.
El Dorado, CA County Value
(5.9%)
The regional value is compared to the El Dorado County value.
US Value
(10.8%)
The regional value is compared to the national value.
Adults without Health Insurance Census Tract: 06017030808
Adults without Health Insurance Census Tract: 06017030808
5.1%
(2021)
Compared to:
CA Census Tracts
The distribution is based on data from 8,005 California census tracts.
U.S. Census Tracts
The distribution is based on data from 68,167 U.S. census tracts.
El Dorado, CA County Value
(5.9%)
The regional value is compared to the El Dorado County value.
US Value
(10.8%)
The regional value is compared to the national value.
Adults without Health Insurance Census Tract: 06017030809
Adults without Health Insurance Census Tract: 06017030809
6.3%
(2021)
Compared to:
CA Census Tracts
The distribution is based on data from 8,005 California census tracts.
U.S. Census Tracts
The distribution is based on data from 68,167 U.S. census tracts.
El Dorado, CA County Value
(5.9%)
The regional value is compared to the El Dorado County value.
US Value
(10.8%)
The regional value is compared to the national value.
Adults without Health Insurance Census Tract: 06017030810
Adults without Health Insurance Census Tract: 06017030810
7.2%
(2021)
Compared to:
CA Census Tracts
The distribution is based on data from 8,005 California census tracts.
U.S. Census Tracts
The distribution is based on data from 68,167 U.S. census tracts.
El Dorado, CA County Value
(5.9%)
The regional value is compared to the El Dorado County value.
US Value
(10.8%)
The regional value is compared to the national value.
Adults without Health Insurance Census Tract: 06017030901
Adults without Health Insurance Census Tract: 06017030901
4.6%
(2021)
Compared to:
CA Census Tracts
The distribution is based on data from 8,005 California census tracts.
U.S. Census Tracts
The distribution is based on data from 68,167 U.S. census tracts.
El Dorado, CA County Value
(5.9%)
The regional value is compared to the El Dorado County value.
US Value
(10.8%)
The regional value is compared to the national value.
Adults without Health Insurance Census Tract: 06017030902
Adults without Health Insurance Census Tract: 06017030902
4.4%
(2021)
Compared to:
CA Census Tracts
The distribution is based on data from 8,005 California census tracts.
U.S. Census Tracts
The distribution is based on data from 68,167 U.S. census tracts.
El Dorado, CA County Value
(5.9%)
The regional value is compared to the El Dorado County value.
US Value
(10.8%)
The regional value is compared to the national value.
Adults without Health Insurance Census Tract: 06017031000
Adults without Health Insurance Census Tract: 06017031000
7.6%
(2021)
Compared to:
CA Census Tracts
The distribution is based on data from 8,005 California census tracts.
U.S. Census Tracts
The distribution is based on data from 68,167 U.S. census tracts.
El Dorado, CA County Value
(5.9%)
The regional value is compared to the El Dorado County value.
US Value
(10.8%)
The regional value is compared to the national value.
Adults without Health Insurance Census Tract: 06017031100
Adults without Health Insurance Census Tract: 06017031100
7.4%
(2021)
Compared to:
CA Census Tracts
The distribution is based on data from 8,005 California census tracts.
U.S. Census Tracts
The distribution is based on data from 68,167 U.S. census tracts.
El Dorado, CA County Value
(5.9%)
The regional value is compared to the El Dorado County value.
US Value
(10.8%)
The regional value is compared to the national value.
Adults without Health Insurance Census Tract: 06017031200
Adults without Health Insurance Census Tract: 06017031200
6.5%
(2021)
Compared to:
CA Census Tracts
The distribution is based on data from 8,005 California census tracts.
U.S. Census Tracts
The distribution is based on data from 68,167 U.S. census tracts.
El Dorado, CA County Value
(5.9%)
The regional value is compared to the El Dorado County value.
US Value
(10.8%)
The regional value is compared to the national value.
Adults without Health Insurance Census Tract: 06017031301
Adults without Health Insurance Census Tract: 06017031301
6.0%
(2021)
Compared to:
CA Census Tracts
The distribution is based on data from 8,005 California census tracts.
U.S. Census Tracts
The distribution is based on data from 68,167 U.S. census tracts.
El Dorado, CA County Value
(5.9%)
The regional value is compared to the El Dorado County value.
US Value
(10.8%)
The regional value is compared to the national value.
Adults without Health Insurance Census Tract: 06017031302
Adults without Health Insurance Census Tract: 06017031302
7.8%
(2021)
Compared to:
CA Census Tracts
The distribution is based on data from 8,005 California census tracts.
U.S. Census Tracts
The distribution is based on data from 68,167 U.S. census tracts.
El Dorado, CA County Value
(5.9%)
The regional value is compared to the El Dorado County value.
US Value
(10.8%)
The regional value is compared to the national value.
Adults without Health Insurance Census Tract: 06017031402
Adults without Health Insurance Census Tract: 06017031402
5.6%
(2021)
Compared to:
CA Census Tracts
The distribution is based on data from 8,005 California census tracts.
U.S. Census Tracts
The distribution is based on data from 68,167 U.S. census tracts.
El Dorado, CA County Value
(5.9%)
The regional value is compared to the El Dorado County value.
US Value
(10.8%)
The regional value is compared to the national value.
Adults without Health Insurance Census Tract: 06017031404
Adults without Health Insurance Census Tract: 06017031404
4.7%
(2021)
Compared to:
CA Census Tracts
The distribution is based on data from 8,005 California census tracts.
U.S. Census Tracts
The distribution is based on data from 68,167 U.S. census tracts.
El Dorado, CA County Value
(5.9%)
The regional value is compared to the El Dorado County value.
US Value
(10.8%)
The regional value is compared to the national value.
Adults without Health Insurance Census Tract: 06017031405
Adults without Health Insurance Census Tract: 06017031405
4.5%
(2021)
Compared to:
CA Census Tracts
The distribution is based on data from 8,005 California census tracts.
U.S. Census Tracts
The distribution is based on data from 68,167 U.S. census tracts.
El Dorado, CA County Value
(5.9%)
The regional value is compared to the El Dorado County value.
US Value
(10.8%)
The regional value is compared to the national value.
Adults without Health Insurance Census Tract: 06017031406
Adults without Health Insurance Census Tract: 06017031406
5.2%
(2021)
Compared to:
CA Census Tracts
The distribution is based on data from 8,005 California census tracts.
U.S. Census Tracts
The distribution is based on data from 68,167 U.S. census tracts.
El Dorado, CA County Value
(5.9%)
The regional value is compared to the El Dorado County value.
US Value
(10.8%)
The regional value is compared to the national value.
Adults without Health Insurance Census Tract: 06017031502
Adults without Health Insurance Census Tract: 06017031502
6.7%
(2021)
Compared to:
CA Census Tracts
The distribution is based on data from 8,005 California census tracts.
U.S. Census Tracts
The distribution is based on data from 68,167 U.S. census tracts.
El Dorado, CA County Value
(5.9%)
The regional value is compared to the El Dorado County value.
US Value
(10.8%)
The regional value is compared to the national value.
Adults without Health Insurance Census Tract: 06017031503
Adults without Health Insurance Census Tract: 06017031503
4.8%
(2021)
Compared to:
CA Census Tracts
The distribution is based on data from 8,005 California census tracts.
U.S. Census Tracts
The distribution is based on data from 68,167 U.S. census tracts.
El Dorado, CA County Value
(5.9%)
The regional value is compared to the El Dorado County value.
US Value
(10.8%)
The regional value is compared to the national value.
Adults without Health Insurance Census Tract: 06017031504
Adults without Health Insurance Census Tract: 06017031504
6.7%
(2021)
Compared to:
CA Census Tracts
The distribution is based on data from 8,005 California census tracts.
U.S. Census Tracts
The distribution is based on data from 68,167 U.S. census tracts.
El Dorado, CA County Value
(5.9%)
The regional value is compared to the El Dorado County value.
US Value
(10.8%)
The regional value is compared to the national value.
Adults without Health Insurance Census Tract: 06017031600
Adults without Health Insurance Census Tract: 06017031600
13.7%
(2021)
Compared to:
CA Census Tracts
The distribution is based on data from 8,005 California census tracts.
U.S. Census Tracts
The distribution is based on data from 68,167 U.S. census tracts.
El Dorado, CA County Value
(5.9%)
The regional value is compared to the El Dorado County value.
US Value
(10.8%)
The regional value is compared to the national value.
Adults without Health Insurance Census Tract: 06017031700
Adults without Health Insurance Census Tract: 06017031700
3.4%
(2021)
Compared to:
CA Census Tracts
The distribution is based on data from 8,005 California census tracts.
U.S. Census Tracts
The distribution is based on data from 68,167 U.S. census tracts.
El Dorado, CA County Value
(5.9%)
The regional value is compared to the El Dorado County value.
US Value
(10.8%)
The regional value is compared to the national value.
Adults without Health Insurance Census Tract: 06017031800
Adults without Health Insurance Census Tract: 06017031800
3.8%
(2021)
Compared to:
CA Census Tracts
The distribution is based on data from 8,005 California census tracts.
U.S. Census Tracts
The distribution is based on data from 68,167 U.S. census tracts.
El Dorado, CA County Value
(5.9%)
The regional value is compared to the El Dorado County value.
US Value
(10.8%)
The regional value is compared to the national value.
Adults without Health Insurance Census Tract: 06017031900
Adults without Health Insurance Census Tract: 06017031900
4.6%
(2021)
Compared to:
CA Census Tracts
The distribution is based on data from 8,005 California census tracts.
U.S. Census Tracts
The distribution is based on data from 68,167 U.S. census tracts.
El Dorado, CA County Value
(5.9%)
The regional value is compared to the El Dorado County value.
US Value
(10.8%)
The regional value is compared to the national value.
Adults without Health Insurance Census Tract: 06017032000
Adults without Health Insurance Census Tract: 06017032000
5.4%
(2021)
Compared to:
CA Census Tracts
The distribution is based on data from 8,005 California census tracts.
U.S. Census Tracts
The distribution is based on data from 68,167 U.S. census tracts.
El Dorado, CA County Value
(5.9%)
The regional value is compared to the El Dorado County value.
US Value
(10.8%)
The regional value is compared to the national value.
Children who Visited a Dentist County: El Dorado
Children who Visited a Dentist County: El Dorado
90.9%
(2019-2020)
Compared to:

CA Value
(89.5%)
The regional value is compared to the California state value.
Prior Value
(92.3%)
Prior Value compares a measured value with the previously measured value. Confidence intervals were taken into account in determining the direction of the comparison.
Children who Visited a Dentist Zip Code: 95667
Children who Visited a Dentist Zip Code: 95667
90.8%
(2019-2020)
Compared to:
El Dorado, CA County Value
(90.9%)
The regional value is compared to the El Dorado County value.
Prior Value
(91.6%)
Prior Value compares a measured value with the previously measured value. Confidence intervals were taken into account in determining the direction of the comparison.
Children who Visited a Dentist Zip Code: 95682
Children who Visited a Dentist Zip Code: 95682
89.9%
(2019-2020)
Compared to:
El Dorado, CA County Value
(90.9%)
The regional value is compared to the El Dorado County value.
Prior Value
(92.9%)
Prior Value compares a measured value with the previously measured value. Confidence intervals were taken into account in determining the direction of the comparison.
Children who Visited a Dentist Zip Code: 95726
Children who Visited a Dentist Zip Code: 95726
93.3%
(2015-2016)
Compared to:
El Dorado, CA County Value
(92.3%)
The regional value is compared to the El Dorado County value.
Children who Visited a Dentist Zip Code: 95762
Children who Visited a Dentist Zip Code: 95762
92.3%
(2015-2016)
Compared to:
El Dorado, CA County Value
(92.3%)
The regional value is compared to the El Dorado County value.
Children with Health Insurance County: El Dorado
Children with Health Insurance County: El Dorado
96.8%
(2022)
Compared to:

CA Counties
The distribution is based on data from 42 California counties.
U.S. Counties
The distribution is based on data from 828 U.S. counties and county equivalents.
CA Value
(96.8%)
The regional value is compared to the California state value.
US Value
(94.9%)
The regional value is compared to the national value.
Prior Value
(97.4%)
Prior Value compares a measured value with the previously measured value. Confidence intervals were taken into account in determining the direction of the comparison.
Trend
This comparison measures the indicator’s values over multiple time periods.<br>The Mann-Kendall Test for Statistical Significance is used to evaluate the trend<br>over 4 to 10 periods of measure, subject to data availability and comparability.
Community Spending on Health Care County: El Dorado
Community Spending on Health Care County: El Dorado
8.5%
(2023)
Compared to:

CA Value
(6.4%)
The regional value is compared to the California state value.
US Value
(8.0%)
The regional value is compared to the national value.
Prior Value
(8.5%)
Prior Value compares a measured value with the previously measured value. Confidence intervals were not taken into account in determining the direction of the comparison.
Community Spending on Health Care Zip Code: 95614
Community Spending on Health Care Zip Code: 95614
10.0%
(2023)
Compared to:
El Dorado, CA County Value
(8.5%)
The regional value is compared to the El Dorado County value.
Prior Value
(10.0%)
Prior Value compares a measured value with the previously measured value. Confidence intervals were not taken into account in determining the direction of the comparison.
Community Spending on Health Care Zip Code: 95619
Community Spending on Health Care Zip Code: 95619
9.3%
(2023)
Compared to:
El Dorado, CA County Value
(8.5%)
The regional value is compared to the El Dorado County value.
Prior Value
(9.3%)
Prior Value compares a measured value with the previously measured value. Confidence intervals were not taken into account in determining the direction of the comparison.
Community Spending on Health Care Zip Code: 95623
Community Spending on Health Care Zip Code: 95623
10.0%
(2023)
Compared to:
El Dorado, CA County Value
(8.5%)
The regional value is compared to the El Dorado County value.
Prior Value
(10.0%)
Prior Value compares a measured value with the previously measured value. Confidence intervals were not taken into account in determining the direction of the comparison.
Community Spending on Health Care Zip Code: 95633
Community Spending on Health Care Zip Code: 95633
10.5%
(2023)
Compared to:
El Dorado, CA County Value
(8.5%)
The regional value is compared to the El Dorado County value.
Prior Value
(10.5%)
Prior Value compares a measured value with the previously measured value. Confidence intervals were not taken into account in determining the direction of the comparison.
Community Spending on Health Care Zip Code: 95634
Community Spending on Health Care Zip Code: 95634
10.7%
(2023)
Compared to:

El Dorado, CA County Value
(8.5%)
The regional value is compared to the El Dorado County value.
Prior Value
(10.8%)
Prior Value compares a measured value with the previously measured value. Confidence intervals were not taken into account in determining the direction of the comparison.
Community Spending on Health Care Zip Code: 95635
Community Spending on Health Care Zip Code: 95635
10.2%
(2023)
Compared to:
El Dorado, CA County Value
(8.5%)
The regional value is compared to the El Dorado County value.
Prior Value
(10.2%)
Prior Value compares a measured value with the previously measured value. Confidence intervals were not taken into account in determining the direction of the comparison.
Community Spending on Health Care Zip Code: 95636
Community Spending on Health Care Zip Code: 95636
10.8%
(2023)
Compared to:
El Dorado, CA County Value
(8.5%)
The regional value is compared to the El Dorado County value.
Prior Value
(10.8%)
Prior Value compares a measured value with the previously measured value. Confidence intervals were not taken into account in determining the direction of the comparison.
Community Spending on Health Care Zip Code: 95651
Community Spending on Health Care Zip Code: 95651
9.6%
(2023)
Compared to:
El Dorado, CA County Value
(8.5%)
The regional value is compared to the El Dorado County value.
Prior Value
(9.7%)
Prior Value compares a measured value with the previously measured value. Confidence intervals were not taken into account in determining the direction of the comparison.
Community Spending on Health Care Zip Code: 95664
Community Spending on Health Care Zip Code: 95664
10.1%
(2023)
Compared to:
El Dorado, CA County Value
(8.5%)
The regional value is compared to the El Dorado County value.
Prior Value
(10.1%)
Prior Value compares a measured value with the previously measured value. Confidence intervals were not taken into account in determining the direction of the comparison.
Community Spending on Health Care Zip Code: 95667
Community Spending on Health Care Zip Code: 95667
9.4%
(2023)
Compared to:
El Dorado, CA County Value
(8.5%)
The regional value is compared to the El Dorado County value.
Prior Value
(9.4%)
Prior Value compares a measured value with the previously measured value. Confidence intervals were not taken into account in determining the direction of the comparison.
Community Spending on Health Care Zip Code: 95672
Community Spending on Health Care Zip Code: 95672
8.4%
(2023)
Compared to:

El Dorado, CA County Value
(8.5%)
The regional value is compared to the El Dorado County value.
Prior Value
(8.4%)
Prior Value compares a measured value with the previously measured value. Confidence intervals were not taken into account in determining the direction of the comparison.
Community Spending on Health Care Zip Code: 95682
Community Spending on Health Care Zip Code: 95682
8.3%
(2023)
Compared to:
El Dorado, CA County Value
(8.5%)
The regional value is compared to the El Dorado County value.
Prior Value
(8.3%)
Prior Value compares a measured value with the previously measured value. Confidence intervals were not taken into account in determining the direction of the comparison.
Community Spending on Health Care Zip Code: 95684
Community Spending on Health Care Zip Code: 95684
10.8%
(2023)
Compared to:
El Dorado, CA County Value
(8.5%)
The regional value is compared to the El Dorado County value.
Prior Value
(10.8%)
Prior Value compares a measured value with the previously measured value. Confidence intervals were not taken into account in determining the direction of the comparison.
Community Spending on Health Care Zip Code: 95709
Community Spending on Health Care Zip Code: 95709
9.5%
(2023)
Compared to:
El Dorado, CA County Value
(8.5%)
The regional value is compared to the El Dorado County value.
Prior Value
(9.5%)
Prior Value compares a measured value with the previously measured value. Confidence intervals were not taken into account in determining the direction of the comparison.
Community Spending on Health Care Zip Code: 95720
Community Spending on Health Care Zip Code: 95720
10.2%
(2023)
Compared to:
El Dorado, CA County Value
(8.5%)
The regional value is compared to the El Dorado County value.
Prior Value
(10.3%)
Prior Value compares a measured value with the previously measured value. Confidence intervals were not taken into account in determining the direction of the comparison.
Community Spending on Health Care Zip Code: 95721
Community Spending on Health Care Zip Code: 95721
10.6%
(2023)
Compared to:

El Dorado, CA County Value
(8.5%)
The regional value is compared to the El Dorado County value.
Prior Value
(10.3%)
Prior Value compares a measured value with the previously measured value. Confidence intervals were not taken into account in determining the direction of the comparison.
Community Spending on Health Care Zip Code: 95726
Community Spending on Health Care Zip Code: 95726
9.6%
(2023)
Compared to:
El Dorado, CA County Value
(8.5%)
The regional value is compared to the El Dorado County value.
Prior Value
(9.6%)
Prior Value compares a measured value with the previously measured value. Confidence intervals were not taken into account in determining the direction of the comparison.
Community Spending on Health Care Zip Code: 95735
Community Spending on Health Care Zip Code: 95735
10.5%
(2023)
Compared to:
El Dorado, CA County Value
(8.5%)
The regional value is compared to the El Dorado County value.
Prior Value
(10.4%)
Prior Value compares a measured value with the previously measured value. Confidence intervals were not taken into account in determining the direction of the comparison.
Community Spending on Health Care Zip Code: 95762
Community Spending on Health Care Zip Code: 95762
7.4%
(2023)
Compared to:
El Dorado, CA County Value
(8.5%)
The regional value is compared to the El Dorado County value.
Prior Value
(7.3%)
Prior Value compares a measured value with the previously measured value. Confidence intervals were not taken into account in determining the direction of the comparison.
Community Spending on Health Care Zip Code: 96142
Community Spending on Health Care Zip Code: 96142
10.0%
(2023)
Compared to:
El Dorado, CA County Value
(8.5%)
The regional value is compared to the El Dorado County value.
Prior Value
(10.0%)
Prior Value compares a measured value with the previously measured value. Confidence intervals were not taken into account in determining the direction of the comparison.
Community Spending on Health Care Zip Code: 96150
Community Spending on Health Care Zip Code: 96150
8.0%
(2023)
Compared to:
El Dorado, CA County Value
(8.5%)
The regional value is compared to the El Dorado County value.
Prior Value
(8.0%)
Prior Value compares a measured value with the previously measured value. Confidence intervals were not taken into account in determining the direction of the comparison.
Community Spending on Health Care Census Tract: 06017030200
Community Spending on Health Care Census Tract: 06017030200
7.2%
(2022)
Compared to:
El Dorado, CA County Value
(8.5%)
The regional value is compared to the El Dorado County value.
Community Spending on Health Care Census Tract: 06017030201
Community Spending on Health Care Census Tract: 06017030201
7.4%
(2023)
Compared to:
El Dorado, CA County Value
(8.5%)
The regional value is compared to the El Dorado County value.
Community Spending on Health Care Census Tract: 06017030202
Community Spending on Health Care Census Tract: 06017030202
7.0%
(2023)
Compared to:
El Dorado, CA County Value
(8.5%)
The regional value is compared to the El Dorado County value.
Community Spending on Health Care Census Tract: 06017030301
Community Spending on Health Care Census Tract: 06017030301
7.4%
(2023)
Compared to:
El Dorado, CA County Value
(8.5%)
The regional value is compared to the El Dorado County value.
Prior Value
(7.4%)
Prior Value compares a measured value with the previously measured value. Confidence intervals were not taken into account in determining the direction of the comparison.
Community Spending on Health Care Census Tract: 06017030302
Community Spending on Health Care Census Tract: 06017030302
7.6%
(2023)
Compared to:
El Dorado, CA County Value
(8.5%)
The regional value is compared to the El Dorado County value.
Prior Value
(7.6%)
Prior Value compares a measured value with the previously measured value. Confidence intervals were not taken into account in determining the direction of the comparison.
Community Spending on Health Care Census Tract: 06017030401
Community Spending on Health Care Census Tract: 06017030401
8.7%
(2022)
Compared to:
El Dorado, CA County Value
(8.5%)
The regional value is compared to the El Dorado County value.
Community Spending on Health Care Census Tract: 06017030402
Community Spending on Health Care Census Tract: 06017030402
8.0%
(2023)
Compared to:
El Dorado, CA County Value
(8.5%)
The regional value is compared to the El Dorado County value.
Prior Value
(8.0%)
Prior Value compares a measured value with the previously measured value. Confidence intervals were not taken into account in determining the direction of the comparison.
Community Spending on Health Care Census Tract: 06017030403
Community Spending on Health Care Census Tract: 06017030403
9.2%
(2023)
Compared to:
El Dorado, CA County Value
(8.5%)
The regional value is compared to the El Dorado County value.
Community Spending on Health Care Census Tract: 06017030404
Community Spending on Health Care Census Tract: 06017030404
8.1%
(2023)
Compared to:
El Dorado, CA County Value
(8.5%)
The regional value is compared to the El Dorado County value.
Community Spending on Health Care Census Tract: 06017030502
Community Spending on Health Care Census Tract: 06017030502
8.4%
(2023)
Compared to:
El Dorado, CA County Value
(8.5%)
The regional value is compared to the El Dorado County value.
Prior Value
(8.4%)
Prior Value compares a measured value with the previously measured value. Confidence intervals were not taken into account in determining the direction of the comparison.
Community Spending on Health Care Census Tract: 06017030504
Community Spending on Health Care Census Tract: 06017030504
8.6%
(2023)
Compared to:
El Dorado, CA County Value
(8.5%)
The regional value is compared to the El Dorado County value.
Prior Value
(8.6%)
Prior Value compares a measured value with the previously measured value. Confidence intervals were not taken into account in determining the direction of the comparison.
Community Spending on Health Care Census Tract: 06017030505
Community Spending on Health Care Census Tract: 06017030505
8.7%
(2022)
Compared to:
El Dorado, CA County Value
(8.5%)
The regional value is compared to the El Dorado County value.
Community Spending on Health Care Census Tract: 06017030506
Community Spending on Health Care Census Tract: 06017030506
9.7%
(2023)
Compared to:
El Dorado, CA County Value
(8.5%)
The regional value is compared to the El Dorado County value.
Community Spending on Health Care Census Tract: 06017030507
Community Spending on Health Care Census Tract: 06017030507
8.3%
(2023)
Compared to:
El Dorado, CA County Value
(8.5%)
The regional value is compared to the El Dorado County value.
Community Spending on Health Care Census Tract: 06017030601
Community Spending on Health Care Census Tract: 06017030601
10.0%
(2023)
Compared to:
El Dorado, CA County Value
(8.5%)
The regional value is compared to the El Dorado County value.
Prior Value
(10.0%)
Prior Value compares a measured value with the previously measured value. Confidence intervals were not taken into account in determining the direction of the comparison.
Community Spending on Health Care Census Tract: 06017030602
Community Spending on Health Care Census Tract: 06017030602
10.5%
(2022)
Compared to:
El Dorado, CA County Value
(8.5%)
The regional value is compared to the El Dorado County value.
Community Spending on Health Care Census Tract: 06017030603
Community Spending on Health Care Census Tract: 06017030603
10.5%
(2023)
Compared to:
El Dorado, CA County Value
(8.5%)
The regional value is compared to the El Dorado County value.
Prior Value
(10.5%)
Prior Value compares a measured value with the previously measured value. Confidence intervals were not taken into account in determining the direction of the comparison.
Community Spending on Health Care Census Tract: 06017030604
Community Spending on Health Care Census Tract: 06017030604
11.0%
(2023)
Compared to:
El Dorado, CA County Value
(8.5%)
The regional value is compared to the El Dorado County value.
Community Spending on Health Care Census Tract: 06017030605
Community Spending on Health Care Census Tract: 06017030605
10.9%
(2023)
Compared to:
El Dorado, CA County Value
(8.5%)
The regional value is compared to the El Dorado County value.
Community Spending on Health Care Census Tract: 06017030606
Community Spending on Health Care Census Tract: 06017030606
10.3%
(2023)
Compared to:
El Dorado, CA County Value
(8.5%)
The regional value is compared to the El Dorado County value.
Community Spending on Health Care Census Tract: 06017030701
Community Spending on Health Care Census Tract: 06017030701
7.6%
(2023)
Compared to:
El Dorado, CA County Value
(8.5%)
The regional value is compared to the El Dorado County value.
Prior Value
(7.6%)
Prior Value compares a measured value with the previously measured value. Confidence intervals were not taken into account in determining the direction of the comparison.
Community Spending on Health Care Census Tract: 06017030704
Community Spending on Health Care Census Tract: 06017030704
7.3%
(2022)
Compared to:
El Dorado, CA County Value
(8.5%)
The regional value is compared to the El Dorado County value.
