Search for Indicators

Access to Health Services Dashboard

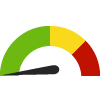
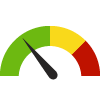
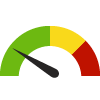
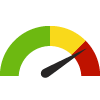
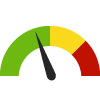
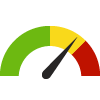
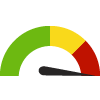
Indicator Gauge Icon Legend

Legend Colors

Red is bad, green is good, blue is not statistically different/neutral.

Compared to Distribution

an indicator guage with the arrow in the green the value is in the best half of communities.

an indicator guage with the arrow in the yellow the value is in the 2nd worst quarter of communities.

an indicator guage with the arrow in the red the value is in the worst quarter of communities.

Compared to Target

green circle with white tick inside it meets target; red circle with white cross inside it does not meet target.

Compared to a Single Value

green diamond with downward arrow inside it lower than the comparison value; red diamond with downward arrow inside it higher than the comparison value; blue diamond with downward arrow inside it not statistically different from comparison value.

Trend

green square outline with upward trending arrow inside it green square outline with downward trending arrow inside it non-significant change over time; green square with upward trending arrow inside it green square with downward trending arrow inside it significant change over time; blue square with equals sign no change over time.

Compared to Prior Value

green triangle with upward trending arrow inside it higher than the previous measurement period; green triangle with downward trending arrow inside it lower than the previous measurement period; blue equals sign no statistically different change  from previous measurement period.

More information about the gauges and icons

Health / Health Care Access & Quality

Health / Health Care Access & Quality

Health / Health Care Access & Quality

Community Spending on Health Care

Value
Compared to:

Health / Health Care Access & Quality

Community Spending on Health Care

Value
Compared to:

Community Spending on Health Care Census Tract: 06017030706

Current Value:

Community Spending on Health Care Census Tract: 06017030706

7.4%
(2023)
Compared to:
Compared to the El Dorado, CA County Value (8.5%), 06017030706 has a value of 7.4%.
El Dorado, CA County Value
(8.5%)
The regional value is compared to the El Dorado County value.
Compared to the prior value, 06017030706 (7.4%) is not statistically different from the previously measured value (7.4%).
Prior Value
(7.4%)
Prior Value compares a measured value with the previously measured value. Confidence intervals were not taken into account in determining the direction of the comparison.

Community Spending on Health Care Census Tract: 06017030709

Current Value:

Community Spending on Health Care Census Tract: 06017030709

7.5%
(2023)
Compared to:
Compared to the El Dorado, CA County Value (8.5%), 06017030709 has a value of 7.5%.
El Dorado, CA County Value
(8.5%)
The regional value is compared to the El Dorado County value.
Compared to the prior value, 06017030709 (7.5%) is not statistically different from the previously measured value (7.5%).
Prior Value
(7.5%)
Prior Value compares a measured value with the previously measured value. Confidence intervals were not taken into account in determining the direction of the comparison.

Community Spending on Health Care Census Tract: 06017030710

Current Value:

Community Spending on Health Care Census Tract: 06017030710

7.6%
(2023)
Compared to:
Compared to the El Dorado, CA County Value (8.5%), 06017030710 has a value of 7.6%.
El Dorado, CA County Value
(8.5%)
The regional value is compared to the El Dorado County value.
Compared to the prior value, 06017030710 (7.6%) is greater  than the previously measured value (7.5%).
Prior Value
(7.5%)
Prior Value compares a measured value with the previously measured value. Confidence intervals were not taken into account in determining the direction of the comparison.

Community Spending on Health Care Census Tract: 06017030711

Current Value:

Community Spending on Health Care Census Tract: 06017030711

7.7%
(2023)
Compared to:
Compared to the El Dorado, CA County Value (8.5%), 06017030711 has a value of 7.7%.
El Dorado, CA County Value
(8.5%)
The regional value is compared to the El Dorado County value.

Community Spending on Health Care Census Tract: 06017030712

Current Value:

Community Spending on Health Care Census Tract: 06017030712

6.8%
(2023)
Compared to:
Compared to the El Dorado, CA County Value (8.5%), 06017030712 has a value of 6.8%.
El Dorado, CA County Value
(8.5%)
The regional value is compared to the El Dorado County value.

Community Spending on Health Care Census Tract: 06017030801

Current Value:

Community Spending on Health Care Census Tract: 06017030801

8.6%
(2023)
Compared to:
Compared to the El Dorado, CA County Value (8.5%), 06017030801 has a value of 8.6%.
El Dorado, CA County Value
(8.5%)
The regional value is compared to the El Dorado County value.
Compared to the prior value, 06017030801 (8.6%) is not statistically different from the previously measured value (8.6%).
Prior Value
(8.6%)
Prior Value compares a measured value with the previously measured value. Confidence intervals were not taken into account in determining the direction of the comparison.

Community Spending on Health Care Census Tract: 06017030803

Current Value:

Community Spending on Health Care Census Tract: 06017030803

8.9%
(2022)
Compared to:
Compared to the El Dorado, CA County Value (8.5%), 06017030803 has a value of 8.9%.
El Dorado, CA County Value
(8.5%)
The regional value is compared to the El Dorado County value.

Community Spending on Health Care Census Tract: 06017030804

Current Value:

Community Spending on Health Care Census Tract: 06017030804

9.5%
(2023)
Compared to:
Compared to the El Dorado, CA County Value (8.5%), 06017030804 has a value of 9.5%.
El Dorado, CA County Value
(8.5%)
The regional value is compared to the El Dorado County value.
Compared to the prior value, 06017030804 (9.5%) is not statistically different from the previously measured value (9.5%).
Prior Value
(9.5%)
Prior Value compares a measured value with the previously measured value. Confidence intervals were not taken into account in determining the direction of the comparison.

Community Spending on Health Care Census Tract: 06017030807

Current Value:

Community Spending on Health Care Census Tract: 06017030807

7.5%
(2023)
Compared to:
Compared to the El Dorado, CA County Value (8.5%), 06017030807 has a value of 7.5%.
El Dorado, CA County Value
(8.5%)
The regional value is compared to the El Dorado County value.
Compared to the prior value, 06017030807 (7.5%) is not statistically different from the previously measured value (7.5%).
Prior Value
(7.5%)
Prior Value compares a measured value with the previously measured value. Confidence intervals were not taken into account in determining the direction of the comparison.

Community Spending on Health Care Census Tract: 06017030808

Current Value:

Community Spending on Health Care Census Tract: 06017030808

7.7%
(2023)
Compared to:
Compared to the El Dorado, CA County Value (8.5%), 06017030808 has a value of 7.7%.
El Dorado, CA County Value
(8.5%)
The regional value is compared to the El Dorado County value.
Compared to the prior value, 06017030808 (7.7%) is not statistically different from the previously measured value (7.7%).
Prior Value
(7.7%)
Prior Value compares a measured value with the previously measured value. Confidence intervals were not taken into account in determining the direction of the comparison.

Community Spending on Health Care Census Tract: 06017030809

Current Value:

Community Spending on Health Care Census Tract: 06017030809

8.1%
(2023)
Compared to:
Compared to the El Dorado, CA County Value (8.5%), 06017030809 has a value of 8.1%.
El Dorado, CA County Value
(8.5%)
The regional value is compared to the El Dorado County value.
Compared to the prior value, 06017030809 (8.1%) is not statistically different from the previously measured value (8.1%).
Prior Value
(8.1%)
Prior Value compares a measured value with the previously measured value. Confidence intervals were not taken into account in determining the direction of the comparison.

Community Spending on Health Care Census Tract: 06017030810

Current Value:

Community Spending on Health Care Census Tract: 06017030810

7.6%
(2023)
Compared to:
Compared to the El Dorado, CA County Value (8.5%), 06017030810 has a value of 7.6%.
El Dorado, CA County Value
(8.5%)
The regional value is compared to the El Dorado County value.
Compared to the prior value, 06017030810 (7.6%) is not statistically different from the previously measured value (7.6%).
Prior Value
(7.6%)
Prior Value compares a measured value with the previously measured value. Confidence intervals were not taken into account in determining the direction of the comparison.

Community Spending on Health Care Census Tract: 06017030811

Current Value:

Community Spending on Health Care Census Tract: 06017030811

8.2%
(2023)
Compared to:
Compared to the El Dorado, CA County Value (8.5%), 06017030811 has a value of 8.2%.
El Dorado, CA County Value
(8.5%)
The regional value is compared to the El Dorado County value.

Community Spending on Health Care Census Tract: 06017030812

Current Value:

Community Spending on Health Care Census Tract: 06017030812

9.1%
(2023)
Compared to:
Compared to the El Dorado, CA County Value (8.5%), 06017030812 has a value of 9.1%.
El Dorado, CA County Value
(8.5%)
The regional value is compared to the El Dorado County value.

Community Spending on Health Care Census Tract: 06017030901

Current Value:

Community Spending on Health Care Census Tract: 06017030901

9.7%
(2023)
Compared to:
Compared to the El Dorado, CA County Value (8.5%), 06017030901 has a value of 9.7%.
El Dorado, CA County Value
(8.5%)
The regional value is compared to the El Dorado County value.
Compared to the prior value, 06017030901 (9.7%) is not statistically different from the previously measured value (9.7%).
Prior Value
(9.7%)
Prior Value compares a measured value with the previously measured value. Confidence intervals were not taken into account in determining the direction of the comparison.

Community Spending on Health Care Census Tract: 06017030902

Current Value:

Community Spending on Health Care Census Tract: 06017030902

9.5%
(2023)
Compared to:
Compared to the El Dorado, CA County Value (8.5%), 06017030902 has a value of 9.5%.
El Dorado, CA County Value
(8.5%)
The regional value is compared to the El Dorado County value.
Compared to the prior value, 06017030902 (9.5%) is not statistically different from the previously measured value (9.5%).
Prior Value
(9.5%)
Prior Value compares a measured value with the previously measured value. Confidence intervals were not taken into account in determining the direction of the comparison.

Community Spending on Health Care Census Tract: 06017031000

Current Value:

Community Spending on Health Care Census Tract: 06017031000

8.4%
(2023)
Compared to:
Compared to the El Dorado, CA County Value (8.5%), 06017031000 has a value of 8.4%.
El Dorado, CA County Value
(8.5%)
The regional value is compared to the El Dorado County value.
Compared to the prior value, 06017031000 (8.4%) is not statistically different from the previously measured value (8.4%).
Prior Value
(8.4%)
Prior Value compares a measured value with the previously measured value. Confidence intervals were not taken into account in determining the direction of the comparison.

Community Spending on Health Care Census Tract: 06017031100

Current Value:

Community Spending on Health Care Census Tract: 06017031100

9.0%
(2023)
Compared to:
Compared to the El Dorado, CA County Value (8.5%), 06017031100 has a value of 9.0%.
El Dorado, CA County Value
(8.5%)
The regional value is compared to the El Dorado County value.
Compared to the prior value, 06017031100 (9.0%) is not statistically different from the previously measured value (9.0%).
Prior Value
(9.0%)
Prior Value compares a measured value with the previously measured value. Confidence intervals were not taken into account in determining the direction of the comparison.

Community Spending on Health Care Census Tract: 06017031200

Current Value:

Community Spending on Health Care Census Tract: 06017031200

9.0%
(2023)
Compared to:
Compared to the El Dorado, CA County Value (8.5%), 06017031200 has a value of 9.0%.
El Dorado, CA County Value
(8.5%)
The regional value is compared to the El Dorado County value.
Compared to the prior value, 06017031200 (9.0%) is not statistically different from the previously measured value (9.0%).
Prior Value
(9.0%)
Prior Value compares a measured value with the previously measured value. Confidence intervals were not taken into account in determining the direction of the comparison.

Community Spending on Health Care Census Tract: 06017031301

Current Value:

Community Spending on Health Care Census Tract: 06017031301

9.7%
(2023)
Compared to:
Compared to the El Dorado, CA County Value (8.5%), 06017031301 has a value of 9.7%.
El Dorado, CA County Value
(8.5%)
The regional value is compared to the El Dorado County value.
Compared to the prior value, 06017031301 (9.7%) is less  than the previously measured value (9.8%).
Prior Value
(9.8%)
Prior Value compares a measured value with the previously measured value. Confidence intervals were not taken into account in determining the direction of the comparison.

Community Spending on Health Care Census Tract: 06017031302

Current Value:

Community Spending on Health Care Census Tract: 06017031302

9.1%
(2023)
Compared to:
Compared to the El Dorado, CA County Value (8.5%), 06017031302 has a value of 9.1%.
El Dorado, CA County Value
(8.5%)
The regional value is compared to the El Dorado County value.
Compared to the prior value, 06017031302 (9.1%) is not statistically different from the previously measured value (9.1%).
Prior Value
(9.1%)
Prior Value compares a measured value with the previously measured value. Confidence intervals were not taken into account in determining the direction of the comparison.

Community Spending on Health Care Census Tract: 06017031402

Current Value:

Community Spending on Health Care Census Tract: 06017031402

10.8%
(2022)
Compared to:
Compared to the El Dorado, CA County Value (8.5%), 06017031402 has a value of 10.8%.
El Dorado, CA County Value
(8.5%)
The regional value is compared to the El Dorado County value.

Community Spending on Health Care Census Tract: 06017031404

Current Value:

Community Spending on Health Care Census Tract: 06017031404

10.4%
(2023)
Compared to:
Compared to the El Dorado, CA County Value (8.5%), 06017031404 has a value of 10.4%.
El Dorado, CA County Value
(8.5%)
The regional value is compared to the El Dorado County value.
Compared to the prior value, 06017031404 (10.4%) is not statistically different from the previously measured value (10.4%).
Prior Value
(10.4%)
Prior Value compares a measured value with the previously measured value. Confidence intervals were not taken into account in determining the direction of the comparison.

Community Spending on Health Care Census Tract: 06017031405

Current Value:

Community Spending on Health Care Census Tract: 06017031405

10.0%
(2023)
Compared to:
Compared to the El Dorado, CA County Value (8.5%), 06017031405 has a value of 10.0%.
El Dorado, CA County Value
(8.5%)
The regional value is compared to the El Dorado County value.
Compared to the prior value, 06017031405 (10.0%) is not statistically different from the previously measured value (10.0%).
Prior Value
(10.0%)
Prior Value compares a measured value with the previously measured value. Confidence intervals were not taken into account in determining the direction of the comparison.

Community Spending on Health Care Census Tract: 06017031406

Current Value:

Community Spending on Health Care Census Tract: 06017031406

9.8%
(2023)
Compared to:
Compared to the El Dorado, CA County Value (8.5%), 06017031406 has a value of 9.8%.
El Dorado, CA County Value
(8.5%)
The regional value is compared to the El Dorado County value.
Compared to the prior value, 06017031406 (9.8%) is not statistically different from the previously measured value (9.8%).
Prior Value
(9.8%)
Prior Value compares a measured value with the previously measured value. Confidence intervals were not taken into account in determining the direction of the comparison.

Community Spending on Health Care Census Tract: 06017031407

Current Value:

Community Spending on Health Care Census Tract: 06017031407

10.5%
(2023)
Compared to:
Compared to the El Dorado, CA County Value (8.5%), 06017031407 has a value of 10.5%.
El Dorado, CA County Value
(8.5%)
The regional value is compared to the El Dorado County value.

Community Spending on Health Care Census Tract: 06017031408

Current Value:

Community Spending on Health Care Census Tract: 06017031408

10.6%
(2023)
Compared to:
Compared to the El Dorado, CA County Value (8.5%), 06017031408 has a value of 10.6%.
El Dorado, CA County Value
(8.5%)
The regional value is compared to the El Dorado County value.

Community Spending on Health Care Census Tract: 06017031409

Current Value:

Community Spending on Health Care Census Tract: 06017031409

11.0%
(2023)
Compared to:
Compared to the El Dorado, CA County Value (8.5%), 06017031409 has a value of 11.0%.
El Dorado, CA County Value
(8.5%)
The regional value is compared to the El Dorado County value.

Community Spending on Health Care Census Tract: 06017031502

Current Value:

Community Spending on Health Care Census Tract: 06017031502

9.1%
(2022)
Compared to:
Compared to the El Dorado, CA County Value (8.5%), 06017031502 has a value of 9.1%.
El Dorado, CA County Value
(8.5%)
The regional value is compared to the El Dorado County value.

Community Spending on Health Care Census Tract: 06017031503

Current Value:

Community Spending on Health Care Census Tract: 06017031503

10.2%
(2023)
Compared to:
Compared to the El Dorado, CA County Value (8.5%), 06017031503 has a value of 10.2%.
El Dorado, CA County Value
(8.5%)
The regional value is compared to the El Dorado County value.
Compared to the prior value, 06017031503 (10.2%) is not statistically different from the previously measured value (10.2%).
Prior Value
(10.2%)
Prior Value compares a measured value with the previously measured value. Confidence intervals were not taken into account in determining the direction of the comparison.

Community Spending on Health Care Census Tract: 06017031504

Current Value:

Community Spending on Health Care Census Tract: 06017031504

9.8%
(2023)
Compared to:
Compared to the El Dorado, CA County Value (8.5%), 06017031504 has a value of 9.8%.
El Dorado, CA County Value
(8.5%)
The regional value is compared to the El Dorado County value.
Compared to the prior value, 06017031504 (9.8%) is not statistically different from the previously measured value (9.8%).
Prior Value
(9.8%)
Prior Value compares a measured value with the previously measured value. Confidence intervals were not taken into account in determining the direction of the comparison.

Community Spending on Health Care Census Tract: 06017031505

Current Value:

Community Spending on Health Care Census Tract: 06017031505

9.0%
(2023)
Compared to:
Compared to the El Dorado, CA County Value (8.5%), 06017031505 has a value of 9.0%.
El Dorado, CA County Value
(8.5%)
The regional value is compared to the El Dorado County value.

Community Spending on Health Care Census Tract: 06017031506

Current Value:

Community Spending on Health Care Census Tract: 06017031506

9.1%
(2023)
Compared to:
Compared to the El Dorado, CA County Value (8.5%), 06017031506 has a value of 9.1%.
El Dorado, CA County Value
(8.5%)
The regional value is compared to the El Dorado County value.

Community Spending on Health Care Census Tract: 06017031600

Current Value:

Community Spending on Health Care Census Tract: 06017031600

7.0%
(2022)
Compared to:
Compared to the El Dorado, CA County Value (8.5%), 06017031600 has a value of 7.0%.
El Dorado, CA County Value
(8.5%)
The regional value is compared to the El Dorado County value.

Community Spending on Health Care Census Tract: 06017031601

Current Value:

Community Spending on Health Care Census Tract: 06017031601

6.7%
(2023)
Compared to:
Compared to the El Dorado, CA County Value (8.5%), 06017031601 has a value of 6.7%.
El Dorado, CA County Value
(8.5%)
The regional value is compared to the El Dorado County value.

Community Spending on Health Care Census Tract: 06017031602

Current Value:

Community Spending on Health Care Census Tract: 06017031602

7.3%
(2023)
Compared to:
Compared to the El Dorado, CA County Value (8.5%), 06017031602 has a value of 7.3%.
El Dorado, CA County Value
(8.5%)
The regional value is compared to the El Dorado County value.

Community Spending on Health Care Census Tract: 06017031700

Current Value:

Community Spending on Health Care Census Tract: 06017031700

7.0%
(2023)
Compared to:
Compared to the El Dorado, CA County Value (8.5%), 06017031700 has a value of 7.0%.
El Dorado, CA County Value
(8.5%)
The regional value is compared to the El Dorado County value.
Compared to the prior value, 06017031700 (7.0%) is greater  than the previously measured value (6.9%).
Prior Value
(6.9%)
Prior Value compares a measured value with the previously measured value. Confidence intervals were not taken into account in determining the direction of the comparison.

Community Spending on Health Care Census Tract: 06017031800

Current Value:

Community Spending on Health Care Census Tract: 06017031800

6.6%
(2023)
Compared to:
Compared to the El Dorado, CA County Value (8.5%), 06017031800 has a value of 6.6%.
El Dorado, CA County Value
(8.5%)
The regional value is compared to the El Dorado County value.
Compared to the prior value, 06017031800 (6.6%) is not statistically different from the previously measured value (6.6%).
Prior Value
(6.6%)
Prior Value compares a measured value with the previously measured value. Confidence intervals were not taken into account in determining the direction of the comparison.

Community Spending on Health Care Census Tract: 06017031900

Current Value:

Community Spending on Health Care Census Tract: 06017031900

11.0%
(2023)
Compared to:
Compared to the El Dorado, CA County Value (8.5%), 06017031900 has a value of 11.0%.
El Dorado, CA County Value
(8.5%)
The regional value is compared to the El Dorado County value.
Compared to the prior value, 06017031900 (11.0%) is not statistically different from the previously measured value (11.0%).
Prior Value
(11.0%)
Prior Value compares a measured value with the previously measured value. Confidence intervals were not taken into account in determining the direction of the comparison.

Community Spending on Health Care Census Tract: 06017032000

Current Value:

Community Spending on Health Care Census Tract: 06017032000

10.2%
(2022)
Compared to:
Compared to the El Dorado, CA County Value (8.5%), 06017032000 has a value of 10.2%.
El Dorado, CA County Value
(8.5%)
The regional value is compared to the El Dorado County value.

Community Spending on Health Care Census Tract: 06017032001

Current Value:

Community Spending on Health Care Census Tract: 06017032001

9.8%
(2023)
Compared to:
Compared to the El Dorado, CA County Value (8.5%), 06017032001 has a value of 9.8%.
El Dorado, CA County Value
(8.5%)
The regional value is compared to the El Dorado County value.

Community Spending on Health Care Census Tract: 06017032002

Current Value:

Community Spending on Health Care Census Tract: 06017032002

11.2%
(2023)
Compared to:
Compared to the El Dorado, CA County Value (8.5%), 06017032002 has a value of 11.2%.
El Dorado, CA County Value
(8.5%)
The regional value is compared to the El Dorado County value.

Health / Health Care Access & Quality

Dentist Rate

Value
Compared to:

Health / Health Care Access & Quality

Dentist Rate

Value
Compared to:

Dentist Rate County: El Dorado

Current Value:

Dentist Rate County: El Dorado

79
Dentists per 100,000 population
(2022)
Compared to:
Compared to CA Counties, El Dorado has a value of 79 which is in the 2nd worst quartile of counties. Counties in the best 50%  have a value higher than 80 while counties in the worst 25% have a value lower than 58.
CA Counties
The distribution is based on data from 58 California counties.
Compared to U.S. Counties, El Dorado has a value of 79 which is in the best 50% of counties. Counties in the best 50%  have a value higher than 43 while counties in the worst 25% have a value lower than 27.
U.S. Counties
The distribution is based on data from 3,054 U.S. counties and county equivalents.
Compared to the CA Value (93), El Dorado has a value of 79 which is lower and worse.
CA Value
(93)
The regional value is compared to the California state value.
Compared to the prior value, El Dorado (79) is not statistically different from the previously measured value (79).
Prior Value
(79)
Prior Value compares a measured value with the previously measured value. Confidence intervals were not taken into account in determining the direction of the comparison.
Over time, the El Dorado value is increasing, not significantly.
Trend
This comparison measures the indicator’s values over multiple time periods.<br>The Mann-Kendall Test for Statistical Significance is used to evaluate the trend<br>over 4 to 10 periods of measure, subject to data availability and comparability.

Health / Health Care Access & Quality

Health Insurance Spending-to-Income Ratio

Value
Compared to:

Health / Health Care Access & Quality

Health Insurance Spending-to-Income Ratio

Value
Compared to:

Health Insurance Spending-to-Income Ratio County: El Dorado

Current Value:

Health Insurance Spending-to-Income Ratio County: El Dorado

5.5%
(2023)
Compared to:
Compared to CA Counties, El Dorado has a value of 5.5% which is in the best 50% of counties. Counties in the best 50% have a value lower than 6.1% while counties in the worst 25% have a value higher than 6.9%.
CA Counties
The distribution is based on data from 58 California counties.
Compared to U.S. Counties, El Dorado has a value of 5.5% which is in the best 50% of counties. Counties in the best 50% have a value lower than 7.5% while counties in the worst 25% have a value higher than 8.4%.
U.S. Counties
The distribution is based on data from 3,141 U.S. counties and county equivalents.
Compared to the CA Value (5.0%), El Dorado has a value of 5.5% which is higher and worse.
CA Value
(5.0%)
The regional value is compared to the California state value.
Compared to the prior value, El Dorado (5.5%) is less and better than the previously measured value (5.6%).
Prior Value
(5.6%)
Prior Value compares a measured value with the previously measured value. Confidence intervals were not taken into account in determining the direction of the comparison.

Health Insurance Spending-to-Income Ratio Zip Code: 95614

Current Value:

Health Insurance Spending-to-Income Ratio Zip Code: 95614

5.6%
(2023)
Compared to:
Compared to CA Zip Codes, 95614 has a value of 5.6% which is in the 2nd worst quartile of zip codes. Zip codes in the best 50% have a value lower than 5.4% while zip codes in the worst 25% have a value higher than 6.7%.
CA Zip Codes
The distribution is based on data from 1,731 California zip codes.
Compared to U.S. Zip Codes, 95614 has a value of 5.6% which is in the best 50% of zip codes. Zip codes in the best 50% have a value lower than 7.1% while zip codes in the worst 25% have a value higher than 8.3%.
U.S. Zip Codes
The distribution is based on data from 31,828 U.S. zip codes.
Compared to the El Dorado, CA County Value (5.5%), 95614 has a value of 5.6% which is higher and worse.
El Dorado, CA County Value
(5.5%)
The regional value is compared to the El Dorado County value.
Compared to the prior value, 95614 (5.6%) is less and better than the previously measured value (5.7%).
Prior Value
(5.7%)
Prior Value compares a measured value with the previously measured value. Confidence intervals were not taken into account in determining the direction of the comparison.

Health Insurance Spending-to-Income Ratio Zip Code: 95619

Current Value:

Health Insurance Spending-to-Income Ratio Zip Code: 95619

7.7%
(2023)
Compared to:
Compared to CA Zip Codes, 95619 has a value of 7.7% which is in the worst 25% of zip codes. Zip codes in the best 50% have a value lower than 5.4% while zip codes in the worst 25% have a value higher than 6.7%.
CA Zip Codes
The distribution is based on data from 1,731 California zip codes.
Compared to U.S. Zip Codes, 95619 has a value of 7.7% which is in the 2nd worst quartile of zip codes. Zip codes in the best 50% have a value lower than 7.1% while zip codes in the worst 25% have a value higher than 8.3%.
U.S. Zip Codes
The distribution is based on data from 31,828 U.S. zip codes.
Compared to the El Dorado, CA County Value (5.5%), 95619 has a value of 7.7% which is higher and worse.
El Dorado, CA County Value
(5.5%)
The regional value is compared to the El Dorado County value.
Compared to the prior value, 95619 (7.7%) is greater and worse than the previously measured value (6.8%).
Prior Value
(6.8%)
Prior Value compares a measured value with the previously measured value. Confidence intervals were not taken into account in determining the direction of the comparison.

Health Insurance Spending-to-Income Ratio Zip Code: 95623

Current Value:

Health Insurance Spending-to-Income Ratio Zip Code: 95623

6.8%
(2023)
Compared to:
Compared to CA Zip Codes, 95623 has a value of 6.8% which is in the worst 25% of zip codes. Zip codes in the best 50% have a value lower than 5.4% while zip codes in the worst 25% have a value higher than 6.7%.
CA Zip Codes
The distribution is based on data from 1,731 California zip codes.
Compared to U.S. Zip Codes, 95623 has a value of 6.8% which is in the best 50% of zip codes. Zip codes in the best 50% have a value lower than 7.1% while zip codes in the worst 25% have a value higher than 8.3%.
U.S. Zip Codes
The distribution is based on data from 31,828 U.S. zip codes.
Compared to the El Dorado, CA County Value (5.5%), 95623 has a value of 6.8% which is higher and worse.
El Dorado, CA County Value
(5.5%)
The regional value is compared to the El Dorado County value.
Compared to the prior value, 95623 (6.8%) is greater and worse than the previously measured value (6.6%).
Prior Value
(6.6%)
Prior Value compares a measured value with the previously measured value. Confidence intervals were not taken into account in determining the direction of the comparison.

Health Insurance Spending-to-Income Ratio Zip Code: 95633

Current Value:

Health Insurance Spending-to-Income Ratio Zip Code: 95633

6.3%
(2023)
Compared to:
Compared to CA Zip Codes, 95633 has a value of 6.3% which is in the 2nd worst quartile of zip codes. Zip codes in the best 50% have a value lower than 5.4% while zip codes in the worst 25% have a value higher than 6.7%.
CA Zip Codes
The distribution is based on data from 1,731 California zip codes.
Compared to U.S. Zip Codes, 95633 has a value of 6.3% which is in the best 50% of zip codes. Zip codes in the best 50% have a value lower than 7.1% while zip codes in the worst 25% have a value higher than 8.3%.
U.S. Zip Codes
The distribution is based on data from 31,828 U.S. zip codes.
Compared to the El Dorado, CA County Value (5.5%), 95633 has a value of 6.3% which is higher and worse.
El Dorado, CA County Value
(5.5%)
The regional value is compared to the El Dorado County value.
Compared to the prior value, 95633 (6.3%) is less and better than the previously measured value (6.7%).
Prior Value
(6.7%)
Prior Value compares a measured value with the previously measured value. Confidence intervals were not taken into account in determining the direction of the comparison.

Health Insurance Spending-to-Income Ratio Zip Code: 95634

Current Value:

Health Insurance Spending-to-Income Ratio Zip Code: 95634

6.2%
(2023)
Compared to:
Compared to CA Zip Codes, 95634 has a value of 6.2% which is in the 2nd worst quartile of zip codes. Zip codes in the best 50% have a value lower than 5.4% while zip codes in the worst 25% have a value higher than 6.7%.
CA Zip Codes
The distribution is based on data from 1,731 California zip codes.
Compared to U.S. Zip Codes, 95634 has a value of 6.2% which is in the best 50% of zip codes. Zip codes in the best 50% have a value lower than 7.1% while zip codes in the worst 25% have a value higher than 8.3%.
U.S. Zip Codes
The distribution is based on data from 31,828 U.S. zip codes.
Compared to the El Dorado, CA County Value (5.5%), 95634 has a value of 6.2% which is higher and worse.
El Dorado, CA County Value
(5.5%)
The regional value is compared to the El Dorado County value.
Compared to the prior value, 95634 (6.2%) is less and better than the previously measured value (7.6%).
Prior Value
(7.6%)
Prior Value compares a measured value with the previously measured value. Confidence intervals were not taken into account in determining the direction of the comparison.

Health Insurance Spending-to-Income Ratio Zip Code: 95635

Current Value:

Health Insurance Spending-to-Income Ratio Zip Code: 95635

6.3%
(2023)
Compared to:
Compared to CA Zip Codes, 95635 has a value of 6.3% which is in the 2nd worst quartile of zip codes. Zip codes in the best 50% have a value lower than 5.4% while zip codes in the worst 25% have a value higher than 6.7%.
CA Zip Codes
The distribution is based on data from 1,731 California zip codes.
Compared to U.S. Zip Codes, 95635 has a value of 6.3% which is in the best 50% of zip codes. Zip codes in the best 50% have a value lower than 7.1% while zip codes in the worst 25% have a value higher than 8.3%.
U.S. Zip Codes
The distribution is based on data from 31,828 U.S. zip codes.
Compared to the El Dorado, CA County Value (5.5%), 95635 has a value of 6.3% which is higher and worse.
El Dorado, CA County Value
(5.5%)
The regional value is compared to the El Dorado County value.
Compared to the prior value, 95635 (6.3%) is less and better than the previously measured value (6.6%).
Prior Value
(6.6%)
Prior Value compares a measured value with the previously measured value. Confidence intervals were not taken into account in determining the direction of the comparison.

Health Insurance Spending-to-Income Ratio Zip Code: 95636

Current Value:

Health Insurance Spending-to-Income Ratio Zip Code: 95636

8.0%
(2023)
Compared to:
Compared to CA Zip Codes, 95636 has a value of 8.0% which is in the worst 25% of zip codes. Zip codes in the best 50% have a value lower than 5.4% while zip codes in the worst 25% have a value higher than 6.7%.
CA Zip Codes
The distribution is based on data from 1,731 California zip codes.
Compared to U.S. Zip Codes, 95636 has a value of 8.0% which is in the 2nd worst quartile of zip codes. Zip codes in the best 50% have a value lower than 7.1% while zip codes in the worst 25% have a value higher than 8.3%.
U.S. Zip Codes
The distribution is based on data from 31,828 U.S. zip codes.
Compared to the El Dorado, CA County Value (5.5%), 95636 has a value of 8.0% which is higher and worse.
El Dorado, CA County Value
(5.5%)
The regional value is compared to the El Dorado County value.
Compared to the prior value, 95636 (8.0%) is greater and worse than the previously measured value (7.8%).
Prior Value
(7.8%)
Prior Value compares a measured value with the previously measured value. Confidence intervals were not taken into account in determining the direction of the comparison.

Health Insurance Spending-to-Income Ratio Zip Code: 95651

Current Value:

Health Insurance Spending-to-Income Ratio Zip Code: 95651

5.7%
(2023)
Compared to:
Compared to CA Zip Codes, 95651 has a value of 5.7% which is in the 2nd worst quartile of zip codes. Zip codes in the best 50% have a value lower than 5.4% while zip codes in the worst 25% have a value higher than 6.7%.
CA Zip Codes
The distribution is based on data from 1,731 California zip codes.
Compared to U.S. Zip Codes, 95651 has a value of 5.7% which is in the best 50% of zip codes. Zip codes in the best 50% have a value lower than 7.1% while zip codes in the worst 25% have a value higher than 8.3%.
U.S. Zip Codes
The distribution is based on data from 31,828 U.S. zip codes.
Compared to the El Dorado, CA County Value (5.5%), 95651 has a value of 5.7% which is higher and worse.
El Dorado, CA County Value
(5.5%)
The regional value is compared to the El Dorado County value.
Compared to the prior value, 95651 (5.7%) is less and better than the previously measured value (5.8%).
Prior Value
(5.8%)
Prior Value compares a measured value with the previously measured value. Confidence intervals were not taken into account in determining the direction of the comparison.

Health Insurance Spending-to-Income Ratio Zip Code: 95664

Current Value:

Health Insurance Spending-to-Income Ratio Zip Code: 95664

6.0%
(2023)
Compared to:
Compared to CA Zip Codes, 95664 has a value of 6.0% which is in the 2nd worst quartile of zip codes. Zip codes in the best 50% have a value lower than 5.4% while zip codes in the worst 25% have a value higher than 6.7%.
CA Zip Codes
The distribution is based on data from 1,731 California zip codes.
Compared to U.S. Zip Codes, 95664 has a value of 6.0% which is in the best 50% of zip codes. Zip codes in the best 50% have a value lower than 7.1% while zip codes in the worst 25% have a value higher than 8.3%.
U.S. Zip Codes
The distribution is based on data from 31,828 U.S. zip codes.
Compared to the El Dorado, CA County Value (5.5%), 95664 has a value of 6.0% which is higher and worse.
El Dorado, CA County Value
(5.5%)
The regional value is compared to the El Dorado County value.
Compared to the prior value, 95664 (6.0%) is less and better than the previously measured value (6.2%).
Prior Value
(6.2%)
Prior Value compares a measured value with the previously measured value. Confidence intervals were not taken into account in determining the direction of the comparison.

Health Insurance Spending-to-Income Ratio Zip Code: 95667

Current Value:

Health Insurance Spending-to-Income Ratio Zip Code: 95667

5.9%
(2023)
Compared to:
Compared to CA Zip Codes, 95667 has a value of 5.9% which is in the 2nd worst quartile of zip codes. Zip codes in the best 50% have a value lower than 5.4% while zip codes in the worst 25% have a value higher than 6.7%.
CA Zip Codes
The distribution is based on data from 1,731 California zip codes.
Compared to U.S. Zip Codes, 95667 has a value of 5.9% which is in the best 50% of zip codes. Zip codes in the best 50% have a value lower than 7.1% while zip codes in the worst 25% have a value higher than 8.3%.
U.S. Zip Codes
The distribution is based on data from 31,828 U.S. zip codes.
Compared to the El Dorado, CA County Value (5.5%), 95667 has a value of 5.9% which is higher and worse.
El Dorado, CA County Value
(5.5%)
The regional value is compared to the El Dorado County value.
Compared to the prior value, 95667 (5.9%) is less and better than the previously measured value (6.1%).
Prior Value
(6.1%)
Prior Value compares a measured value with the previously measured value. Confidence intervals were not taken into account in determining the direction of the comparison.

Health Insurance Spending-to-Income Ratio Zip Code: 95672

Current Value:

Health Insurance Spending-to-Income Ratio Zip Code: 95672

4.9%
(2023)
Compared to:
Compared to CA Zip Codes, 95672 has a value of 4.9% which is in the best 50% of zip codes. Zip codes in the best 50% have a value lower than 5.4% while zip codes in the worst 25% have a value higher than 6.7%.
CA Zip Codes
The distribution is based on data from 1,731 California zip codes.
Compared to U.S. Zip Codes, 95672 has a value of 4.9% which is in the best 50% of zip codes. Zip codes in the best 50% have a value lower than 7.1% while zip codes in the worst 25% have a value higher than 8.3%.
U.S. Zip Codes
The distribution is based on data from 31,828 U.S. zip codes.
Compared to the El Dorado, CA County Value (5.5%), 95672 has a value of 4.9% which is lower and better.
El Dorado, CA County Value
(5.5%)
The regional value is compared to the El Dorado County value.
Compared to the prior value, 95672 (4.9%) is not statistically different from the previously measured value (4.9%).
Prior Value
(4.9%)
Prior Value compares a measured value with the previously measured value. Confidence intervals were not taken into account in determining the direction of the comparison.

Health Insurance Spending-to-Income Ratio Zip Code: 95682

Current Value:

Health Insurance Spending-to-Income Ratio Zip Code: 95682

5.3%
(2023)
Compared to:
Compared to CA Zip Codes, 95682 has a value of 5.3% which is in the best 50% of zip codes. Zip codes in the best 50% have a value lower than 5.4% while zip codes in the worst 25% have a value higher than 6.7%.
CA Zip Codes
The distribution is based on data from 1,731 California zip codes.
Compared to U.S. Zip Codes, 95682 has a value of 5.3% which is in the best 50% of zip codes. Zip codes in the best 50% have a value lower than 7.1% while zip codes in the worst 25% have a value higher than 8.3%.
U.S. Zip Codes
The distribution is based on data from 31,828 U.S. zip codes.
Compared to the El Dorado, CA County Value (5.5%), 95682 has a value of 5.3% which is lower and better.
El Dorado, CA County Value
(5.5%)
The regional value is compared to the El Dorado County value.
Compared to the prior value, 95682 (5.3%) is not statistically different from the previously measured value (5.3%).
Prior Value
(5.3%)
Prior Value compares a measured value with the previously measured value. Confidence intervals were not taken into account in determining the direction of the comparison.

Health Insurance Spending-to-Income Ratio Zip Code: 95684

Current Value:

Health Insurance Spending-to-Income Ratio Zip Code: 95684

7.1%
(2023)
Compared to:
Compared to CA Zip Codes, 95684 has a value of 7.1% which is in the worst 25% of zip codes. Zip codes in the best 50% have a value lower than 5.4% while zip codes in the worst 25% have a value higher than 6.7%.
CA Zip Codes
The distribution is based on data from 1,731 California zip codes.
Compared to U.S. Zip Codes, 95684 has a value of 7.1% which is in the best 50% of zip codes. Zip codes in the best 50% have a value lower than 7.1% while zip codes in the worst 25% have a value higher than 8.3%.
U.S. Zip Codes
The distribution is based on data from 31,828 U.S. zip codes.
Compared to the El Dorado, CA County Value (5.5%), 95684 has a value of 7.1% which is higher and worse.
El Dorado, CA County Value
(5.5%)
The regional value is compared to the El Dorado County value.
Compared to the prior value, 95684 (7.1%) is less and better than the previously measured value (7.7%).
Prior Value
(7.7%)
Prior Value compares a measured value with the previously measured value. Confidence intervals were not taken into account in determining the direction of the comparison.

Health Insurance Spending-to-Income Ratio Zip Code: 95709

Current Value:

Health Insurance Spending-to-Income Ratio Zip Code: 95709

6.5%
(2023)
Compared to:
Compared to CA Zip Codes, 95709 has a value of 6.5% which is in the 2nd worst quartile of zip codes. Zip codes in the best 50% have a value lower than 5.4% while zip codes in the worst 25% have a value higher than 6.7%.
CA Zip Codes
The distribution is based on data from 1,731 California zip codes.
Compared to U.S. Zip Codes, 95709 has a value of 6.5% which is in the best 50% of zip codes. Zip codes in the best 50% have a value lower than 7.1% while zip codes in the worst 25% have a value higher than 8.3%.
U.S. Zip Codes
The distribution is based on data from 31,828 U.S. zip codes.
Compared to the El Dorado, CA County Value (5.5%), 95709 has a value of 6.5% which is higher and worse.
El Dorado, CA County Value
(5.5%)
The regional value is compared to the El Dorado County value.
Compared to the prior value, 95709 (6.5%) is greater and worse than the previously measured value (6.0%).
Prior Value
(6.0%)
Prior Value compares a measured value with the previously measured value. Confidence intervals were not taken into account in determining the direction of the comparison.

Health Insurance Spending-to-Income Ratio Zip Code: 95720

Current Value:

Health Insurance Spending-to-Income Ratio Zip Code: 95720

6.9%
(2023)
Compared to:
Compared to CA Zip Codes, 95720 has a value of 6.9% which is in the worst 25% of zip codes. Zip codes in the best 50% have a value lower than 5.4% while zip codes in the worst 25% have a value higher than 6.7%.
CA Zip Codes
The distribution is based on data from 1,731 California zip codes.
Compared to U.S. Zip Codes, 95720 has a value of 6.9% which is in the best 50% of zip codes. Zip codes in the best 50% have a value lower than 7.1% while zip codes in the worst 25% have a value higher than 8.3%.
U.S. Zip Codes
The distribution is based on data from 31,828 U.S. zip codes.
Compared to the El Dorado, CA County Value (5.5%), 95720 has a value of 6.9% which is higher and worse.
El Dorado, CA County Value
(5.5%)
The regional value is compared to the El Dorado County value.
Compared to the prior value, 95720 (6.9%) is less and better than the previously measured value (7.2%).
Prior Value
(7.2%)
Prior Value compares a measured value with the previously measured value. Confidence intervals were not taken into account in determining the direction of the comparison.

Health Insurance Spending-to-Income Ratio Zip Code: 95721

Current Value:

Health Insurance Spending-to-Income Ratio Zip Code: 95721

6.1%
(2023)
Compared to:
Compared to CA Zip Codes, 95721 has a value of 6.1% which is in the 2nd worst quartile of zip codes. Zip codes in the best 50% have a value lower than 5.4% while zip codes in the worst 25% have a value higher than 6.7%.
CA Zip Codes
The distribution is based on data from 1,731 California zip codes.
Compared to U.S. Zip Codes, 95721 has a value of 6.1% which is in the best 50% of zip codes. Zip codes in the best 50% have a value lower than 7.1% while zip codes in the worst 25% have a value higher than 8.3%.
U.S. Zip Codes
The distribution is based on data from 31,828 U.S. zip codes.
Compared to the El Dorado, CA County Value (5.5%), 95721 has a value of 6.1% which is higher and worse.
El Dorado, CA County Value
(5.5%)
The regional value is compared to the El Dorado County value.
Compared to the prior value, 95721 (6.1%) is greater and worse than the previously measured value (4.2%).
Prior Value
(4.2%)
Prior Value compares a measured value with the previously measured value. Confidence intervals were not taken into account in determining the direction of the comparison.

Health Insurance Spending-to-Income Ratio Zip Code: 95726

Current Value:

Health Insurance Spending-to-Income Ratio Zip Code: 95726

6.4%
(2023)
Compared to:
Compared to CA Zip Codes, 95726 has a value of 6.4% which is in the 2nd worst quartile of zip codes. Zip codes in the best 50% have a value lower than 5.4% while zip codes in the worst 25% have a value higher than 6.7%.
CA Zip Codes
The distribution is based on data from 1,731 California zip codes.
Compared to U.S. Zip Codes, 95726 has a value of 6.4% which is in the best 50% of zip codes. Zip codes in the best 50% have a value lower than 7.1% while zip codes in the worst 25% have a value higher than 8.3%.
U.S. Zip Codes
The distribution is based on data from 31,828 U.S. zip codes.
Compared to the El Dorado, CA County Value (5.5%), 95726 has a value of 6.4% which is higher and worse.
El Dorado, CA County Value
(5.5%)
The regional value is compared to the El Dorado County value.
Compared to the prior value, 95726 (6.4%) is greater and worse than the previously measured value (6.2%).
Prior Value
(6.2%)
Prior Value compares a measured value with the previously measured value. Confidence intervals were not taken into account in determining the direction of the comparison.

Health Insurance Spending-to-Income Ratio Zip Code: 95735

Current Value:

Health Insurance Spending-to-Income Ratio Zip Code: 95735

7.0%
(2023)
Compared to:
Compared to CA Zip Codes, 95735 has a value of 7.0% which is in the worst 25% of zip codes. Zip codes in the best 50% have a value lower than 5.4% while zip codes in the worst 25% have a value higher than 6.7%.
CA Zip Codes
The distribution is based on data from 1,731 California zip codes.
Compared to U.S. Zip Codes, 95735 has a value of 7.0% which is in the best 50% of zip codes. Zip codes in the best 50% have a value lower than 7.1% while zip codes in the worst 25% have a value higher than 8.3%.
U.S. Zip Codes
The distribution is based on data from 31,828 U.S. zip codes.
Compared to the El Dorado, CA County Value (5.5%), 95735 has a value of 7.0% which is higher and worse.
El Dorado, CA County Value
(5.5%)
The regional value is compared to the El Dorado County value.
Compared to the prior value, 95735 (7.0%) is less and better than the previously measured value (7.3%).
Prior Value
(7.3%)
Prior Value compares a measured value with the previously measured value. Confidence intervals were not taken into account in determining the direction of the comparison.

Health Insurance Spending-to-Income Ratio Zip Code: 95762

Current Value:

Health Insurance Spending-to-Income Ratio Zip Code: 95762

4.4%
(2023)
Compared to:
Compared to CA Zip Codes, 95762 has a value of 4.4% which is in the best 50% of zip codes. Zip codes in the best 50% have a value lower than 5.4% while zip codes in the worst 25% have a value higher than 6.7%.
CA Zip Codes
The distribution is based on data from 1,731 California zip codes.
Compared to U.S. Zip Codes, 95762 has a value of 4.4% which is in the best 50% of zip codes. Zip codes in the best 50% have a value lower than 7.1% while zip codes in the worst 25% have a value higher than 8.3%.
U.S. Zip Codes
The distribution is based on data from 31,828 U.S. zip codes.
Compared to the El Dorado, CA County Value (5.5%), 95762 has a value of 4.4% which is lower and better.
El Dorado, CA County Value
(5.5%)
The regional value is compared to the El Dorado County value.
Compared to the prior value, 95762 (4.4%) is greater and worse than the previously measured value (4.1%).
Prior Value
(4.1%)
Prior Value compares a measured value with the previously measured value. Confidence intervals were not taken into account in determining the direction of the comparison.

Health Insurance Spending-to-Income Ratio Zip Code: 96142

Current Value:

Health Insurance Spending-to-Income Ratio Zip Code: 96142

6.2%
(2023)
Compared to:
Compared to CA Zip Codes, 96142 has a value of 6.2% which is in the 2nd worst quartile of zip codes. Zip codes in the best 50% have a value lower than 5.4% while zip codes in the worst 25% have a value higher than 6.7%.
CA Zip Codes
The distribution is based on data from 1,731 California zip codes.
Compared to U.S. Zip Codes, 96142 has a value of 6.2% which is in the best 50% of zip codes. Zip codes in the best 50% have a value lower than 7.1% while zip codes in the worst 25% have a value higher than 8.3%.
U.S. Zip Codes
The distribution is based on data from 31,828 U.S. zip codes.
Compared to the El Dorado, CA County Value (5.5%), 96142 has a value of 6.2% which is higher and worse.
El Dorado, CA County Value
(5.5%)
The regional value is compared to the El Dorado County value.
Compared to the prior value, 96142 (6.2%) is less and better than the previously measured value (6.5%).
Prior Value
(6.5%)
Prior Value compares a measured value with the previously measured value. Confidence intervals were not taken into account in determining the direction of the comparison.

Health Insurance Spending-to-Income Ratio Zip Code: 96150

Current Value:

Health Insurance Spending-to-Income Ratio Zip Code: 96150

6.1%
(2023)
Compared to:
Compared to CA Zip Codes, 96150 has a value of 6.1% which is in the 2nd worst quartile of zip codes. Zip codes in the best 50% have a value lower than 5.4% while zip codes in the worst 25% have a value higher than 6.7%.
CA Zip Codes
The distribution is based on data from 1,731 California zip codes.
Compared to U.S. Zip Codes, 96150 has a value of 6.1% which is in the best 50% of zip codes. Zip codes in the best 50% have a value lower than 7.1% while zip codes in the worst 25% have a value higher than 8.3%.
U.S. Zip Codes
The distribution is based on data from 31,828 U.S. zip codes.
Compared to the El Dorado, CA County Value (5.5%), 96150 has a value of 6.1% which is higher and worse.
El Dorado, CA County Value
(5.5%)
The regional value is compared to the El Dorado County value.
Compared to the prior value, 96150 (6.1%) is less and better than the previously measured value (6.4%).
Prior Value
(6.4%)
Prior Value compares a measured value with the previously measured value. Confidence intervals were not taken into account in determining the direction of the comparison.

Health Insurance Spending-to-Income Ratio Census Tract: 06017030200

Current Value:

Health Insurance Spending-to-Income Ratio Census Tract: 06017030200

6.1%
(2022)
Compared to:
Compared to CA Census Tracts, 06017030200 has a value of 6.1% which is in the worst 25% of census tracts. Census tracts in the best 50% have a value lower than 4.9% while census tracts in the worst 25% have a value higher than 5.9%.
CA Census Tracts
The distribution is based on data from 8,008 California census tracts.
Compared to U.S. Census Tracts, 06017030200 has a value of 6.1% which is in the best 50% of census tracts. Census tracts in the best 50% have a value lower than 6.5% while census tracts in the worst 25% have a value higher than 7.8%.
U.S. Census Tracts
The distribution is based on data from 72,424 U.S. census tracts.
Compared to the El Dorado, CA County Value (5.6%), 06017030200 has a value of 6.1% which is higher and worse.
El Dorado, CA County Value
(5.6%)
The regional value is compared to the El Dorado County value.

Health Insurance Spending-to-Income Ratio Census Tract: 06017030201

Current Value:

Health Insurance Spending-to-Income Ratio Census Tract: 06017030201

6.0%
(2023)
Compared to:
Compared to CA Census Tracts, 06017030201 has a value of 6.0% which is in the worst 25% of census tracts. Census tracts in the best 50% have a value lower than 4.9% while census tracts in the worst 25% have a value higher than 5.9%.
CA Census Tracts
The distribution is based on data from 9,086 California census tracts.
Compared to U.S. Census Tracts, 06017030201 has a value of 6.0% which is in the best 50% of census tracts. Census tracts in the best 50% have a value lower than 6.3% while census tracts in the worst 25% have a value higher than 7.6%.
U.S. Census Tracts
The distribution is based on data from 83,789 U.S. census tracts.
Compared to the El Dorado, CA County Value (5.5%), 06017030201 has a value of 6.0% which is higher and worse.
El Dorado, CA County Value
(5.5%)
The regional value is compared to the El Dorado County value.

Health Insurance Spending-to-Income Ratio Census Tract: 06017030202

Current Value:

Health Insurance Spending-to-Income Ratio Census Tract: 06017030202

5.7%
(2023)
Compared to:
Compared to CA Census Tracts, 06017030202 has a value of 5.7% which is in the 2nd worst quartile of census tracts. Census tracts in the best 50% have a value lower than 4.9% while census tracts in the worst 25% have a value higher than 5.9%.
CA Census Tracts
The distribution is based on data from 9,086 California census tracts.
Compared to U.S. Census Tracts, 06017030202 has a value of 5.7% which is in the best 50% of census tracts. Census tracts in the best 50% have a value lower than 6.3% while census tracts in the worst 25% have a value higher than 7.6%.
U.S. Census Tracts
The distribution is based on data from 83,789 U.S. census tracts.
Compared to the El Dorado, CA County Value (5.5%), 06017030202 has a value of 5.7% which is higher and worse.
El Dorado, CA County Value
(5.5%)
The regional value is compared to the El Dorado County value.

Health Insurance Spending-to-Income Ratio Census Tract: 06017030301

Current Value:

Health Insurance Spending-to-Income Ratio Census Tract: 06017030301

6.3%
(2023)
Compared to:
Compared to CA Census Tracts, 06017030301 has a value of 6.3% which is in the worst 25% of census tracts. Census tracts in the best 50% have a value lower than 4.9% while census tracts in the worst 25% have a value higher than 5.9%.
CA Census Tracts
The distribution is based on data from 9,086 California census tracts.
Compared to U.S. Census Tracts, 06017030301 has a value of 6.3% which is in the best 50% of census tracts. Census tracts in the best 50% have a value lower than 6.3% while census tracts in the worst 25% have a value higher than 7.6%.
U.S. Census Tracts
The distribution is based on data from 83,789 U.S. census tracts.
Compared to the El Dorado, CA County Value (5.5%), 06017030301 has a value of 6.3% which is higher and worse.
El Dorado, CA County Value
(5.5%)
The regional value is compared to the El Dorado County value.
Compared to the prior value, 06017030301 (6.3%) is greater and worse than the previously measured value (5.7%).
Prior Value
(5.7%)
Prior Value compares a measured value with the previously measured value. Confidence intervals were not taken into account in determining the direction of the comparison.

Health Insurance Spending-to-Income Ratio Census Tract: 06017030302

Current Value:

Health Insurance Spending-to-Income Ratio Census Tract: 06017030302

5.4%
(2023)
Compared to:
Compared to CA Census Tracts, 06017030302 has a value of 5.4% which is in the 2nd worst quartile of census tracts. Census tracts in the best 50% have a value lower than 4.9% while census tracts in the worst 25% have a value higher than 5.9%.
CA Census Tracts
The distribution is based on data from 9,086 California census tracts.
Compared to U.S. Census Tracts, 06017030302 has a value of 5.4% which is in the best 50% of census tracts. Census tracts in the best 50% have a value lower than 6.3% while census tracts in the worst 25% have a value higher than 7.6%.
U.S. Census Tracts
The distribution is based on data from 83,789 U.S. census tracts.
Compared to the El Dorado, CA County Value (5.5%), 06017030302 has a value of 5.4% which is lower and better.
El Dorado, CA County Value
(5.5%)
The regional value is compared to the El Dorado County value.
Compared to the prior value, 06017030302 (5.4%) is less and better than the previously measured value (6.3%).
Prior Value
(6.3%)
Prior Value compares a measured value with the previously measured value. Confidence intervals were not taken into account in determining the direction of the comparison.

Health Insurance Spending-to-Income Ratio Census Tract: 06017030401

Current Value:

Health Insurance Spending-to-Income Ratio Census Tract: 06017030401

6.0%
(2022)
Compared to:
Compared to CA Census Tracts, 06017030401 has a value of 6.0% which is in the worst 25% of census tracts. Census tracts in the best 50% have a value lower than 4.9% while census tracts in the worst 25% have a value higher than 5.9%.
CA Census Tracts
The distribution is based on data from 8,008 California census tracts.
Compared to U.S. Census Tracts, 06017030401 has a value of 6.0% which is in the best 50% of census tracts. Census tracts in the best 50% have a value lower than 6.5% while census tracts in the worst 25% have a value higher than 7.8%.
U.S. Census Tracts
The distribution is based on data from 72,424 U.S. census tracts.
Compared to the El Dorado, CA County Value (5.6%), 06017030401 has a value of 6.0% which is higher and worse.
El Dorado, CA County Value
(5.6%)
The regional value is compared to the El Dorado County value.

Health Insurance Spending-to-Income Ratio Census Tract: 06017030402

Current Value:

Health Insurance Spending-to-Income Ratio Census Tract: 06017030402

6.0%
(2023)
Compared to:
Compared to CA Census Tracts, 06017030402 has a value of 6.0% which is in the worst 25% of census tracts. Census tracts in the best 50% have a value lower than 4.9% while census tracts in the worst 25% have a value higher than 5.9%.
CA Census Tracts
The distribution is based on data from 9,086 California census tracts.
Compared to U.S. Census Tracts, 06017030402 has a value of 6.0% which is in the best 50% of census tracts. Census tracts in the best 50% have a value lower than 6.3% while census tracts in the worst 25% have a value higher than 7.6%.
U.S. Census Tracts
The distribution is based on data from 83,789 U.S. census tracts.
Compared to the El Dorado, CA County Value (5.5%), 06017030402 has a value of 6.0% which is higher and worse.
El Dorado, CA County Value
(5.5%)
The regional value is compared to the El Dorado County value.
Compared to the prior value, 06017030402 (6.0%) is less and better than the previously measured value (6.7%).
Prior Value
(6.7%)
Prior Value compares a measured value with the previously measured value. Confidence intervals were not taken into account in determining the direction of the comparison.

Health Insurance Spending-to-Income Ratio Census Tract: 06017030403

Current Value:

Health Insurance Spending-to-Income Ratio Census Tract: 06017030403

5.4%
(2023)
Compared to:
Compared to CA Census Tracts, 06017030403 has a value of 5.4% which is in the 2nd worst quartile of census tracts. Census tracts in the best 50% have a value lower than 4.9% while census tracts in the worst 25% have a value higher than 5.9%.
CA Census Tracts
The distribution is based on data from 9,086 California census tracts.
Compared to U.S. Census Tracts, 06017030403 has a value of 5.4% which is in the best 50% of census tracts. Census tracts in the best 50% have a value lower than 6.3% while census tracts in the worst 25% have a value higher than 7.6%.
U.S. Census Tracts
The distribution is based on data from 83,789 U.S. census tracts.
Compared to the El Dorado, CA County Value (5.5%), 06017030403 has a value of 5.4% which is lower and better.
El Dorado, CA County Value
(5.5%)
The regional value is compared to the El Dorado County value.

Health Insurance Spending-to-Income Ratio Census Tract: 06017030404

Current Value:

Health Insurance Spending-to-Income Ratio Census Tract: 06017030404

5.2%
(2023)
Compared to:
Compared to CA Census Tracts, 06017030404 has a value of 5.2% which is in the 2nd worst quartile of census tracts. Census tracts in the best 50% have a value lower than 4.9% while census tracts in the worst 25% have a value higher than 5.9%.
CA Census Tracts
The distribution is based on data from 9,086 California census tracts.
Compared to U.S. Census Tracts, 06017030404 has a value of 5.2% which is in the best 50% of census tracts. Census tracts in the best 50% have a value lower than 6.3% while census tracts in the worst 25% have a value higher than 7.6%.
U.S. Census Tracts
The distribution is based on data from 83,789 U.S. census tracts.
Compared to the El Dorado, CA County Value (5.5%), 06017030404 has a value of 5.2% which is lower and better.
El Dorado, CA County Value
(5.5%)
The regional value is compared to the El Dorado County value.

Health Insurance Spending-to-Income Ratio Census Tract: 06017030502

Current Value:

Health Insurance Spending-to-Income Ratio Census Tract: 06017030502

5.5%
(2023)
Compared to:
Compared to CA Census Tracts, 06017030502 has a value of 5.5% which is in the 2nd worst quartile of census tracts. Census tracts in the best 50% have a value lower than 4.9% while census tracts in the worst 25% have a value higher than 5.9%.
CA Census Tracts
The distribution is based on data from 9,086 California census tracts.
Compared to U.S. Census Tracts, 06017030502 has a value of 5.5% which is in the best 50% of census tracts. Census tracts in the best 50% have a value lower than 6.3% while census tracts in the worst 25% have a value higher than 7.6%.
U.S. Census Tracts
The distribution is based on data from 83,789 U.S. census tracts.
Compared to the El Dorado, CA County Value (5.5%), 06017030502 has a value of 5.5%.
El Dorado, CA County Value
(5.5%)
The regional value is compared to the El Dorado County value.
Compared to the prior value, 06017030502 (5.5%) is greater and worse than the previously measured value (5.1%).
Prior Value
(5.1%)
Prior Value compares a measured value with the previously measured value. Confidence intervals were not taken into account in determining the direction of the comparison.

Health Insurance Spending-to-Income Ratio Census Tract: 06017030504

Current Value:

Health Insurance Spending-to-Income Ratio Census Tract: 06017030504

6.1%
(2023)
Compared to:
Compared to CA Census Tracts, 06017030504 has a value of 6.1% which is in the worst 25% of census tracts. Census tracts in the best 50% have a value lower than 4.9% while census tracts in the worst 25% have a value higher than 5.9%.
CA Census Tracts
The distribution is based on data from 9,086 California census tracts.
Compared to U.S. Census Tracts, 06017030504 has a value of 6.1% which is in the best 50% of census tracts. Census tracts in the best 50% have a value lower than 6.3% while census tracts in the worst 25% have a value higher than 7.6%.
U.S. Census Tracts
The distribution is based on data from 83,789 U.S. census tracts.
Compared to the El Dorado, CA County Value (5.5%), 06017030504 has a value of 6.1% which is higher and worse.
El Dorado, CA County Value
(5.5%)
The regional value is compared to the El Dorado County value.
Compared to the prior value, 06017030504 (6.1%) is less and better than the previously measured value (6.2%).
Prior Value
(6.2%)
Prior Value compares a measured value with the previously measured value. Confidence intervals were not taken into account in determining the direction of the comparison.

Health Insurance Spending-to-Income Ratio Census Tract: 06017030505

Current Value:

Health Insurance Spending-to-Income Ratio Census Tract: 06017030505

5.7%
(2022)
Compared to:
Compared to CA Census Tracts, 06017030505 has a value of 5.7% which is in the 2nd worst quartile of census tracts. Census tracts in the best 50% have a value lower than 4.9% while census tracts in the worst 25% have a value higher than 5.9%.
CA Census Tracts
The distribution is based on data from 8,008 California census tracts.
Compared to U.S. Census Tracts, 06017030505 has a value of 5.7% which is in the best 50% of census tracts. Census tracts in the best 50% have a value lower than 6.5% while census tracts in the worst 25% have a value higher than 7.8%.
U.S. Census Tracts
The distribution is based on data from 72,424 U.S. census tracts.
Compared to the El Dorado, CA County Value (5.6%), 06017030505 has a value of 5.7% which is higher and worse.
El Dorado, CA County Value
(5.6%)
The regional value is compared to the El Dorado County value.

Health Insurance Spending-to-Income Ratio Census Tract: 06017030506

Current Value:

Health Insurance Spending-to-Income Ratio Census Tract: 06017030506

6.8%
(2023)
Compared to:
Compared to CA Census Tracts, 06017030506 has a value of 6.8% which is in the worst 25% of census tracts. Census tracts in the best 50% have a value lower than 4.9% while census tracts in the worst 25% have a value higher than 5.9%.
CA Census Tracts
The distribution is based on data from 9,086 California census tracts.
Compared to U.S. Census Tracts, 06017030506 has a value of 6.8% which is in the 2nd worst quartile of census tracts. Census tracts in the best 50% have a value lower than 6.3% while census tracts in the worst 25% have a value higher than 7.6%.
U.S. Census Tracts
The distribution is based on data from 83,789 U.S. census tracts.
Compared to the El Dorado, CA County Value (5.5%), 06017030506 has a value of 6.8% which is higher and worse.
El Dorado, CA County Value
(5.5%)
The regional value is compared to the El Dorado County value.

Health Insurance Spending-to-Income Ratio Census Tract: 06017030507

Current Value:

Health Insurance Spending-to-Income Ratio Census Tract: 06017030507

4.8%
(2023)
Compared to:
Compared to CA Census Tracts, 06017030507 has a value of 4.8% which is in the best 50% of census tracts. Census tracts in the best 50% have a value lower than 4.9% while census tracts in the worst 25% have a value higher than 5.9%.
CA Census Tracts
The distribution is based on data from 9,086 California census tracts.
Compared to U.S. Census Tracts, 06017030507 has a value of 4.8% which is in the best 50% of census tracts. Census tracts in the best 50% have a value lower than 6.3% while census tracts in the worst 25% have a value higher than 7.6%.
U.S. Census Tracts
The distribution is based on data from 83,789 U.S. census tracts.
Compared to the El Dorado, CA County Value (5.5%), 06017030507 has a value of 4.8% which is lower and better.
El Dorado, CA County Value
(5.5%)
The regional value is compared to the El Dorado County value.

Health Insurance Spending-to-Income Ratio Census Tract: 06017030601

Current Value:

Health Insurance Spending-to-Income Ratio Census Tract: 06017030601

5.7%
(2023)
Compared to:
Compared to CA Census Tracts, 06017030601 has a value of 5.7% which is in the 2nd worst quartile of census tracts. Census tracts in the best 50% have a value lower than 4.9% while census tracts in the worst 25% have a value higher than 5.9%.
CA Census Tracts
The distribution is based on data from 9,086 California census tracts.
Compared to U.S. Census Tracts, 06017030601 has a value of 5.7% which is in the best 50% of census tracts. Census tracts in the best 50% have a value lower than 6.3% while census tracts in the worst 25% have a value higher than 7.6%.
U.S. Census Tracts
The distribution is based on data from 83,789 U.S. census tracts.
Compared to the El Dorado, CA County Value (5.5%), 06017030601 has a value of 5.7% which is higher and worse.
El Dorado, CA County Value
(5.5%)
The regional value is compared to the El Dorado County value.
Compared to the prior value, 06017030601 (5.7%) is less and better than the previously measured value (5.8%).
Prior Value
(5.8%)
Prior Value compares a measured value with the previously measured value. Confidence intervals were not taken into account in determining the direction of the comparison.

Health Insurance Spending-to-Income Ratio Census Tract: 06017030602

Current Value:

Health Insurance Spending-to-Income Ratio Census Tract: 06017030602

6.9%
(2022)
Compared to:
Compared to CA Census Tracts, 06017030602 has a value of 6.9% which is in the worst 25% of census tracts. Census tracts in the best 50% have a value lower than 4.9% while census tracts in the worst 25% have a value higher than 5.9%.
CA Census Tracts
The distribution is based on data from 8,008 California census tracts.
Compared to U.S. Census Tracts, 06017030602 has a value of 6.9% which is in the 2nd worst quartile of census tracts. Census tracts in the best 50% have a value lower than 6.5% while census tracts in the worst 25% have a value higher than 7.8%.
U.S. Census Tracts
The distribution is based on data from 72,424 U.S. census tracts.
Compared to the El Dorado, CA County Value (5.6%), 06017030602 has a value of 6.9% which is higher and worse.
El Dorado, CA County Value
(5.6%)
The regional value is compared to the El Dorado County value.

Health Insurance Spending-to-Income Ratio Census Tract: 06017030603

Current Value:

Health Insurance Spending-to-Income Ratio Census Tract: 06017030603

5.4%
(2023)
Compared to:
Compared to CA Census Tracts, 06017030603 has a value of 5.4% which is in the 2nd worst quartile of census tracts. Census tracts in the best 50% have a value lower than 4.9% while census tracts in the worst 25% have a value higher than 5.9%.
CA Census Tracts
The distribution is based on data from 9,086 California census tracts.
Compared to U.S. Census Tracts, 06017030603 has a value of 5.4% which is in the best 50% of census tracts. Census tracts in the best 50% have a value lower than 6.3% while census tracts in the worst 25% have a value higher than 7.6%.
U.S. Census Tracts
The distribution is based on data from 83,789 U.S. census tracts.
Compared to the El Dorado, CA County Value (5.5%), 06017030603 has a value of 5.4% which is lower and better.
El Dorado, CA County Value
(5.5%)
The regional value is compared to the El Dorado County value.
Compared to the prior value, 06017030603 (5.4%) is less and better than the previously measured value (7.2%).
Prior Value
(7.2%)
Prior Value compares a measured value with the previously measured value. Confidence intervals were not taken into account in determining the direction of the comparison.

Health Insurance Spending-to-Income Ratio Census Tract: 06017030604

Current Value:

Health Insurance Spending-to-Income Ratio Census Tract: 06017030604

12.9%
(2023)
Compared to:
Compared to CA Census Tracts, 06017030604 has a value of 12.9% which is in the worst 25% of census tracts. Census tracts in the best 50% have a value lower than 4.9% while census tracts in the worst 25% have a value higher than 5.9%.
CA Census Tracts
The distribution is based on data from 9,086 California census tracts.
Compared to U.S. Census Tracts, 06017030604 has a value of 12.9% which is in the worst 25% of census tracts. Census tracts in the best 50% have a value lower than 6.3% while census tracts in the worst 25% have a value higher than 7.6%.
U.S. Census Tracts
The distribution is based on data from 83,789 U.S. census tracts.
Compared to the El Dorado, CA County Value (5.5%), 06017030604 has a value of 12.9% which is higher and worse.
El Dorado, CA County Value
(5.5%)
The regional value is compared to the El Dorado County value.

Health Insurance Spending-to-Income Ratio Census Tract: 06017030605

Current Value:

Health Insurance Spending-to-Income Ratio Census Tract: 06017030605

6.1%
(2023)
Compared to:
Compared to CA Census Tracts, 06017030605 has a value of 6.1% which is in the worst 25% of census tracts. Census tracts in the best 50% have a value lower than 4.9% while census tracts in the worst 25% have a value higher than 5.9%.
CA Census Tracts
The distribution is based on data from 9,086 California census tracts.
Compared to U.S. Census Tracts, 06017030605 has a value of 6.1% which is in the best 50% of census tracts. Census tracts in the best 50% have a value lower than 6.3% while census tracts in the worst 25% have a value higher than 7.6%.
U.S. Census Tracts
The distribution is based on data from 83,789 U.S. census tracts.
Compared to the El Dorado, CA County Value (5.5%), 06017030605 has a value of 6.1% which is higher and worse.
El Dorado, CA County Value
(5.5%)
The regional value is compared to the El Dorado County value.

Health Insurance Spending-to-Income Ratio Census Tract: 06017030606

Current Value:

Health Insurance Spending-to-Income Ratio Census Tract: 06017030606

6.6%
(2023)
Compared to:
Compared to CA Census Tracts, 06017030606 has a value of 6.6% which is in the worst 25% of census tracts. Census tracts in the best 50% have a value lower than 4.9% while census tracts in the worst 25% have a value higher than 5.9%.
CA Census Tracts
The distribution is based on data from 9,086 California census tracts.
Compared to U.S. Census Tracts, 06017030606 has a value of 6.6% which is in the 2nd worst quartile of census tracts. Census tracts in the best 50% have a value lower than 6.3% while census tracts in the worst 25% have a value higher than 7.6%.
U.S. Census Tracts
The distribution is based on data from 83,789 U.S. census tracts.
Compared to the El Dorado, CA County Value (5.5%), 06017030606 has a value of 6.6% which is higher and worse.
El Dorado, CA County Value
(5.5%)
The regional value is compared to the El Dorado County value.

Health Insurance Spending-to-Income Ratio Census Tract: 06017030701

Current Value:

Health Insurance Spending-to-Income Ratio Census Tract: 06017030701

4.9%
(2023)
Compared to:
Compared to CA Census Tracts, 06017030701 has a value of 4.9% which is in the best 50% of census tracts. Census tracts in the best 50% have a value lower than 4.9% while census tracts in the worst 25% have a value higher than 5.9%.
CA Census Tracts
The distribution is based on data from 9,086 California census tracts.
Compared to U.S. Census Tracts, 06017030701 has a value of 4.9% which is in the best 50% of census tracts. Census tracts in the best 50% have a value lower than 6.3% while census tracts in the worst 25% have a value higher than 7.6%.
U.S. Census Tracts
The distribution is based on data from 83,789 U.S. census tracts.
Compared to the El Dorado, CA County Value (5.5%), 06017030701 has a value of 4.9% which is lower and better.
El Dorado, CA County Value
(5.5%)
The regional value is compared to the El Dorado County value.
Compared to the prior value, 06017030701 (4.9%) is greater and worse than the previously measured value (4.4%).
Prior Value
(4.4%)
Prior Value compares a measured value with the previously measured value. Confidence intervals were not taken into account in determining the direction of the comparison.

Health Insurance Spending-to-Income Ratio Census Tract: 06017030704

Current Value:

Health Insurance Spending-to-Income Ratio Census Tract: 06017030704

3.7%
(2022)
Compared to:
Compared to CA Census Tracts, 06017030704 has a value of 3.7% which is in the best 50% of census tracts. Census tracts in the best 50% have a value lower than 4.9% while census tracts in the worst 25% have a value higher than 5.9%.
CA Census Tracts
The distribution is based on data from 8,008 California census tracts.
Compared to U.S. Census Tracts, 06017030704 has a value of 3.7% which is in the best 50% of census tracts. Census tracts in the best 50% have a value lower than 6.5% while census tracts in the worst 25% have a value higher than 7.8%.
U.S. Census Tracts
The distribution is based on data from 72,424 U.S. census tracts.
Compared to the El Dorado, CA County Value (5.6%), 06017030704 has a value of 3.7% which is lower and better.
El Dorado, CA County Value
(5.6%)
The regional value is compared to the El Dorado County value.

Health Insurance Spending-to-Income Ratio Census Tract: 06017030706

Current Value:

Health Insurance Spending-to-Income Ratio Census Tract: 06017030706

4.5%
(2023)
Compared to:
Compared to CA Census Tracts, 06017030706 has a value of 4.5% which is in the best 50% of census tracts. Census tracts in the best 50% have a value lower than 4.9% while census tracts in the worst 25% have a value higher than 5.9%.
CA Census Tracts
The distribution is based on data from 9,086 California census tracts.
Compared to U.S. Census Tracts, 06017030706 has a value of 4.5% which is in the best 50% of census tracts. Census tracts in the best 50% have a value lower than 6.3% while census tracts in the worst 25% have a value higher than 7.6%.
U.S. Census Tracts
The distribution is based on data from 83,789 U.S. census tracts.
Compared to the El Dorado, CA County Value (5.5%), 06017030706 has a value of 4.5% which is lower and better.
El Dorado, CA County Value
(5.5%)
The regional value is compared to the El Dorado County value.
Compared to the prior value, 06017030706 (4.5%) is greater and worse than the previously measured value (4.3%).
Prior Value
(4.3%)
Prior Value compares a measured value with the previously measured value. Confidence intervals were not taken into account in determining the direction of the comparison.

Health Insurance Spending-to-Income Ratio Census Tract: 06017030709

Current Value:

Health Insurance Spending-to-Income Ratio Census Tract: 06017030709

3.9%
(2023)
Compared to:
Compared to CA Census Tracts, 06017030709 has a value of 3.9% which is in the best 50% of census tracts. Census tracts in the best 50% have a value lower than 4.9% while census tracts in the worst 25% have a value higher than 5.9%.
CA Census Tracts
The distribution is based on data from 9,086 California census tracts.
Compared to U.S. Census Tracts, 06017030709 has a value of 3.9% which is in the best 50% of census tracts. Census tracts in the best 50% have a value lower than 6.3% while census tracts in the worst 25% have a value higher than 7.6%.
U.S. Census Tracts
The distribution is based on data from 83,789 U.S. census tracts.
Compared to the El Dorado, CA County Value (5.5%), 06017030709 has a value of 3.9% which is lower and better.
El Dorado, CA County Value
(5.5%)
The regional value is compared to the El Dorado County value.
Compared to the prior value, 06017030709 (3.9%) is less and better than the previously measured value (4.0%).
Prior Value
(4.0%)
Prior Value compares a measured value with the previously measured value. Confidence intervals were not taken into account in determining the direction of the comparison.

Health Insurance Spending-to-Income Ratio Census Tract: 06017030710

Current Value:

Health Insurance Spending-to-Income Ratio Census Tract: 06017030710

4.8%
(2023)
Compared to:
Compared to CA Census Tracts, 06017030710 has a value of 4.8% which is in the best 50% of census tracts. Census tracts in the best 50% have a value lower than 4.9% while census tracts in the worst 25% have a value higher than 5.9%.
CA Census Tracts
The distribution is based on data from 9,086 California census tracts.
Compared to U.S. Census Tracts, 06017030710 has a value of 4.8% which is in the best 50% of census tracts. Census tracts in the best 50% have a value lower than 6.3% while census tracts in the worst 25% have a value higher than 7.6%.
U.S. Census Tracts
The distribution is based on data from 83,789 U.S. census tracts.
Compared to the El Dorado, CA County Value (5.5%), 06017030710 has a value of 4.8% which is lower and better.
El Dorado, CA County Value
(5.5%)
The regional value is compared to the El Dorado County value.
Compared to the prior value, 06017030710 (4.8%) is greater and worse than the previously measured value (4.0%).
Prior Value
(4.0%)
Prior Value compares a measured value with the previously measured value. Confidence intervals were not taken into account in determining the direction of the comparison.

Health Insurance Spending-to-Income Ratio Census Tract: 06017030711

Current Value:

Health Insurance Spending-to-Income Ratio Census Tract: 06017030711

5.6%
(2023)
Compared to:
Compared to CA Census Tracts, 06017030711 has a value of 5.6% which is in the 2nd worst quartile of census tracts. Census tracts in the best 50% have a value lower than 4.9% while census tracts in the worst 25% have a value higher than 5.9%.
CA Census Tracts
The distribution is based on data from 9,086 California census tracts.
Compared to U.S. Census Tracts, 06017030711 has a value of 5.6% which is in the best 50% of census tracts. Census tracts in the best 50% have a value lower than 6.3% while census tracts in the worst 25% have a value higher than 7.6%.
U.S. Census Tracts
The distribution is based on data from 83,789 U.S. census tracts.
Compared to the El Dorado, CA County Value (5.5%), 06017030711 has a value of 5.6% which is higher and worse.
El Dorado, CA County Value
(5.5%)
The regional value is compared to the El Dorado County value.

Health Insurance Spending-to-Income Ratio Census Tract: 06017030712

Current Value:

Health Insurance Spending-to-Income Ratio Census Tract: 06017030712

2.4%
(2023)
Compared to:
Compared to CA Census Tracts, 06017030712 has a value of 2.4% which is in the best 50% of census tracts. Census tracts in the best 50% have a value lower than 4.9% while census tracts in the worst 25% have a value higher than 5.9%.
CA Census Tracts
The distribution is based on data from 9,086 California census tracts.
Compared to U.S. Census Tracts, 06017030712 has a value of 2.4% which is in the best 50% of census tracts. Census tracts in the best 50% have a value lower than 6.3% while census tracts in the worst 25% have a value higher than 7.6%.
U.S. Census Tracts
The distribution is based on data from 83,789 U.S. census tracts.
Compared to the El Dorado, CA County Value (5.5%), 06017030712 has a value of 2.4% which is lower and better.
El Dorado, CA County Value
(5.5%)
The regional value is compared to the El Dorado County value.

Health Insurance Spending-to-Income Ratio Census Tract: 06017030801

Current Value:

Health Insurance Spending-to-Income Ratio Census Tract: 06017030801

4.9%
(2023)
Compared to:
Compared to CA Census Tracts, 06017030801 has a value of 4.9% which is in the best 50% of census tracts. Census tracts in the best 50% have a value lower than 4.9% while census tracts in the worst 25% have a value higher than 5.9%.
CA Census Tracts
The distribution is based on data from 9,086 California census tracts.
Compared to U.S. Census Tracts, 06017030801 has a value of 4.9% which is in the best 50% of census tracts. Census tracts in the best 50% have a value lower than 6.3% while census tracts in the worst 25% have a value higher than 7.6%.
U.S. Census Tracts
The distribution is based on data from 83,789 U.S. census tracts.
Compared to the El Dorado, CA County Value (5.5%), 06017030801 has a value of 4.9% which is lower and better.
El Dorado, CA County Value
(5.5%)
The regional value is compared to the El Dorado County value.
Compared to the prior value, 06017030801 (4.9%) is not statistically different from the previously measured value (4.9%).
Prior Value
(4.9%)
Prior Value compares a measured value with the previously measured value. Confidence intervals were not taken into account in determining the direction of the comparison.

Health Insurance Spending-to-Income Ratio Census Tract: 06017030803

Current Value:

Health Insurance Spending-to-Income Ratio Census Tract: 06017030803

5.9%
(2022)
Compared to:
Compared to CA Census Tracts, 06017030803 has a value of 5.9% which is in the worst 25% of census tracts. Census tracts in the best 50% have a value lower than 4.9% while census tracts in the worst 25% have a value higher than 5.9%.
CA Census Tracts
The distribution is based on data from 8,008 California census tracts.
Compared to U.S. Census Tracts, 06017030803 has a value of 5.9% which is in the best 50% of census tracts. Census tracts in the best 50% have a value lower than 6.5% while census tracts in the worst 25% have a value higher than 7.8%.
U.S. Census Tracts
The distribution is based on data from 72,424 U.S. census tracts.
Compared to the El Dorado, CA County Value (5.6%), 06017030803 has a value of 5.9% which is higher and worse.
El Dorado, CA County Value
(5.6%)
The regional value is compared to the El Dorado County value.

Health Insurance Spending-to-Income Ratio Census Tract: 06017030804

Current Value:

Health Insurance Spending-to-Income Ratio Census Tract: 06017030804

5.5%
(2023)
Compared to:
Compared to CA Census Tracts, 06017030804 has a value of 5.5% which is in the 2nd worst quartile of census tracts. Census tracts in the best 50% have a value lower than 4.9% while census tracts in the worst 25% have a value higher than 5.9%.
CA Census Tracts
The distribution is based on data from 9,086 California census tracts.
Compared to U.S. Census Tracts, 06017030804 has a value of 5.5% which is in the best 50% of census tracts. Census tracts in the best 50% have a value lower than 6.3% while census tracts in the worst 25% have a value higher than 7.6%.
U.S. Census Tracts
The distribution is based on data from 83,789 U.S. census tracts.
Compared to the El Dorado, CA County Value (5.5%), 06017030804 has a value of 5.5%.
El Dorado, CA County Value
(5.5%)
The regional value is compared to the El Dorado County value.
Compared to the prior value, 06017030804 (5.5%) is not statistically different from the previously measured value (5.5%).
Prior Value
(5.5%)
Prior Value compares a measured value with the previously measured value. Confidence intervals were not taken into account in determining the direction of the comparison.

Health Insurance Spending-to-Income Ratio Census Tract: 06017030807

Current Value:

Health Insurance Spending-to-Income Ratio Census Tract: 06017030807

4.8%
(2023)
Compared to:
Compared to CA Census Tracts, 06017030807 has a value of 4.8% which is in the best 50% of census tracts. Census tracts in the best 50% have a value lower than 4.9% while census tracts in the worst 25% have a value higher than 5.9%.
CA Census Tracts
The distribution is based on data from 9,086 California census tracts.
Compared to U.S. Census Tracts, 06017030807 has a value of 4.8% which is in the best 50% of census tracts. Census tracts in the best 50% have a value lower than 6.3% while census tracts in the worst 25% have a value higher than 7.6%.
U.S. Census Tracts
The distribution is based on data from 83,789 U.S. census tracts.
Compared to the El Dorado, CA County Value (5.5%), 06017030807 has a value of 4.8% which is lower and better.
El Dorado, CA County Value
(5.5%)
The regional value is compared to the El Dorado County value.
Compared to the prior value, 06017030807 (4.8%) is not statistically different from the previously measured value (4.8%).
Prior Value
(4.8%)
Prior Value compares a measured value with the previously measured value. Confidence intervals were not taken into account in determining the direction of the comparison.

Health Insurance Spending-to-Income Ratio Census Tract: 06017030808

Current Value:

Health Insurance Spending-to-Income Ratio Census Tract: 06017030808

5.4%
(2023)
Compared to:
Compared to CA Census Tracts, 06017030808 has a value of 5.4% which is in the 2nd worst quartile of census tracts. Census tracts in the best 50% have a value lower than 4.9% while census tracts in the worst 25% have a value higher than 5.9%.
CA Census Tracts
The distribution is based on data from 9,086 California census tracts.
Compared to U.S. Census Tracts, 06017030808 has a value of 5.4% which is in the best 50% of census tracts. Census tracts in the best 50% have a value lower than 6.3% while census tracts in the worst 25% have a value higher than 7.6%.
U.S. Census Tracts
The distribution is based on data from 83,789 U.S. census tracts.
Compared to the El Dorado, CA County Value (5.5%), 06017030808 has a value of 5.4% which is lower and better.
El Dorado, CA County Value
(5.5%)
The regional value is compared to the El Dorado County value.
Compared to the prior value, 06017030808 (5.4%) is greater and worse than the previously measured value (5.0%).
Prior Value
(5.0%)
Prior Value compares a measured value with the previously measured value. Confidence intervals were not taken into account in determining the direction of the comparison.

Health Insurance Spending-to-Income Ratio Census Tract: 06017030809

Current Value:

Health Insurance Spending-to-Income Ratio Census Tract: 06017030809

5.6%
(2023)
Compared to:
Compared to CA Census Tracts, 06017030809 has a value of 5.6% which is in the 2nd worst quartile of census tracts. Census tracts in the best 50% have a value lower than 4.9% while census tracts in the worst 25% have a value higher than 5.9%.
CA Census Tracts
The distribution is based on data from 9,086 California census tracts.
Compared to U.S. Census Tracts, 06017030809 has a value of 5.6% which is in the best 50% of census tracts. Census tracts in the best 50% have a value lower than 6.3% while census tracts in the worst 25% have a value higher than 7.6%.
U.S. Census Tracts
The distribution is based on data from 83,789 U.S. census tracts.
Compared to the El Dorado, CA County Value (5.5%), 06017030809 has a value of 5.6% which is higher and worse.
El Dorado, CA County Value
(5.5%)
The regional value is compared to the El Dorado County value.
Compared to the prior value, 06017030809 (5.6%) is not statistically different from the previously measured value (5.6%).
Prior Value
(5.6%)
Prior Value compares a measured value with the previously measured value. Confidence intervals were not taken into account in determining the direction of the comparison.

Health Insurance Spending-to-Income Ratio Census Tract: 06017030810

Current Value:

Health Insurance Spending-to-Income Ratio Census Tract: 06017030810

5.3%
(2023)
Compared to:
Compared to CA Census Tracts, 06017030810 has a value of 5.3% which is in the 2nd worst quartile of census tracts. Census tracts in the best 50% have a value lower than 4.9% while census tracts in the worst 25% have a value higher than 5.9%.
CA Census Tracts
The distribution is based on data from 9,086 California census tracts.
Compared to U.S. Census Tracts, 06017030810 has a value of 5.3% which is in the best 50% of census tracts. Census tracts in the best 50% have a value lower than 6.3% while census tracts in the worst 25% have a value higher than 7.6%.
U.S. Census Tracts
The distribution is based on data from 83,789 U.S. census tracts.
Compared to the El Dorado, CA County Value (5.5%), 06017030810 has a value of 5.3% which is lower and better.
El Dorado, CA County Value
(5.5%)
The regional value is compared to the El Dorado County value.
Compared to the prior value, 06017030810 (5.3%) is less and better than the previously measured value (5.4%).
Prior Value
(5.4%)
Prior Value compares a measured value with the previously measured value. Confidence intervals were not taken into account in determining the direction of the comparison.

Health Insurance Spending-to-Income Ratio Census Tract: 06017030811

Current Value:

Health Insurance Spending-to-Income Ratio Census Tract: 06017030811

6.2%
(2023)
Compared to:
Compared to CA Census Tracts, 06017030811 has a value of 6.2% which is in the worst 25% of census tracts. Census tracts in the best 50% have a value lower than 4.9% while census tracts in the worst 25% have a value higher than 5.9%.
CA Census Tracts
The distribution is based on data from 9,086 California census tracts.
Compared to U.S. Census Tracts, 06017030811 has a value of 6.2% which is in the best 50% of census tracts. Census tracts in the best 50% have a value lower than 6.3% while census tracts in the worst 25% have a value higher than 7.6%.
U.S. Census Tracts
The distribution is based on data from 83,789 U.S. census tracts.
Compared to the El Dorado, CA County Value (5.5%), 06017030811 has a value of 6.2% which is higher and worse.
El Dorado, CA County Value
(5.5%)
The regional value is compared to the El Dorado County value.

Health Insurance Spending-to-Income Ratio Census Tract: 06017030812

Current Value:

Health Insurance Spending-to-Income Ratio Census Tract: 06017030812

5.6%
(2023)
Compared to:
Compared to CA Census Tracts, 06017030812 has a value of 5.6% which is in the 2nd worst quartile of census tracts. Census tracts in the best 50% have a value lower than 4.9% while census tracts in the worst 25% have a value higher than 5.9%.
CA Census Tracts
The distribution is based on data from 9,086 California census tracts.
Compared to U.S. Census Tracts, 06017030812 has a value of 5.6% which is in the best 50% of census tracts. Census tracts in the best 50% have a value lower than 6.3% while census tracts in the worst 25% have a value higher than 7.6%.
U.S. Census Tracts
The distribution is based on data from 83,789 U.S. census tracts.
Compared to the El Dorado, CA County Value (5.5%), 06017030812 has a value of 5.6% which is higher and worse.
El Dorado, CA County Value
(5.5%)
The regional value is compared to the El Dorado County value.

Health Insurance Spending-to-Income Ratio Census Tract: 06017030901

Current Value:

Health Insurance Spending-to-Income Ratio Census Tract: 06017030901

5.0%
(2023)
Compared to:
Compared to CA Census Tracts, 06017030901 has a value of 5.0% which is in the 2nd worst quartile of census tracts. Census tracts in the best 50% have a value lower than 4.9% while census tracts in the worst 25% have a value higher than 5.9%.
CA Census Tracts
The distribution is based on data from 9,086 California census tracts.
Compared to U.S. Census Tracts, 06017030901 has a value of 5.0% which is in the best 50% of census tracts. Census tracts in the best 50% have a value lower than 6.3% while census tracts in the worst 25% have a value higher than 7.6%.
U.S. Census Tracts
The distribution is based on data from 83,789 U.S. census tracts.
Compared to the El Dorado, CA County Value (5.5%), 06017030901 has a value of 5.0% which is lower and better.
El Dorado, CA County Value
(5.5%)
The regional value is compared to the El Dorado County value.
Compared to the prior value, 06017030901 (5.0%) is less and better than the previously measured value (5.3%).
Prior Value
(5.3%)
Prior Value compares a measured value with the previously measured value. Confidence intervals were not taken into account in determining the direction of the comparison.

Health Insurance Spending-to-Income Ratio Census Tract: 06017030902

Current Value:

Health Insurance Spending-to-Income Ratio Census Tract: 06017030902

4.9%
(2023)
Compared to:
Compared to CA Census Tracts, 06017030902 has a value of 4.9% which is in the best 50% of census tracts. Census tracts in the best 50% have a value lower than 4.9% while census tracts in the worst 25% have a value higher than 5.9%.
CA Census Tracts
The distribution is based on data from 9,086 California census tracts.
Compared to U.S. Census Tracts, 06017030902 has a value of 4.9% which is in the best 50% of census tracts. Census tracts in the best 50% have a value lower than 6.3% while census tracts in the worst 25% have a value higher than 7.6%.
U.S. Census Tracts
The distribution is based on data from 83,789 U.S. census tracts.
Compared to the El Dorado, CA County Value (5.5%), 06017030902 has a value of 4.9% which is lower and better.
El Dorado, CA County Value
(5.5%)
The regional value is compared to the El Dorado County value.
Compared to the prior value, 06017030902 (4.9%) is greater and worse than the previously measured value (4.8%).
Prior Value
(4.8%)
Prior Value compares a measured value with the previously measured value. Confidence intervals were not taken into account in determining the direction of the comparison.

Health Insurance Spending-to-Income Ratio Census Tract: 06017031000

Current Value:

Health Insurance Spending-to-Income Ratio Census Tract: 06017031000

5.7%
(2023)
Compared to:
Compared to CA Census Tracts, 06017031000 has a value of 5.7% which is in the 2nd worst quartile of census tracts. Census tracts in the best 50% have a value lower than 4.9% while census tracts in the worst 25% have a value higher than 5.9%.
CA Census Tracts
The distribution is based on data from 9,086 California census tracts.
Compared to U.S. Census Tracts, 06017031000 has a value of 5.7% which is in the best 50% of census tracts. Census tracts in the best 50% have a value lower than 6.3% while census tracts in the worst 25% have a value higher than 7.6%.
U.S. Census Tracts
The distribution is based on data from 83,789 U.S. census tracts.
Compared to the El Dorado, CA County Value (5.5%), 06017031000 has a value of 5.7% which is higher and worse.
El Dorado, CA County Value
(5.5%)
The regional value is compared to the El Dorado County value.
Compared to the prior value, 06017031000 (5.7%) is less and better than the previously measured value (6.1%).
Prior Value
(6.1%)
Prior Value compares a measured value with the previously measured value. Confidence intervals were not taken into account in determining the direction of the comparison.

Health Insurance Spending-to-Income Ratio Census Tract: 06017031100

Current Value:

Health Insurance Spending-to-Income Ratio Census Tract: 06017031100

5.8%
(2023)
Compared to:
Compared to CA Census Tracts, 06017031100 has a value of 5.8% which is in the 2nd worst quartile of census tracts. Census tracts in the best 50% have a value lower than 4.9% while census tracts in the worst 25% have a value higher than 5.9%.
CA Census Tracts
The distribution is based on data from 9,086 California census tracts.
Compared to U.S. Census Tracts, 06017031100 has a value of 5.8% which is in the best 50% of census tracts. Census tracts in the best 50% have a value lower than 6.3% while census tracts in the worst 25% have a value higher than 7.6%.
U.S. Census Tracts
The distribution is based on data from 83,789 U.S. census tracts.
Compared to the El Dorado, CA County Value (5.5%), 06017031100 has a value of 5.8% which is higher and worse.
El Dorado, CA County Value
(5.5%)
The regional value is compared to the El Dorado County value.
Compared to the prior value, 06017031100 (5.8%) is less and better than the previously measured value (6.3%).
Prior Value
(6.3%)
Prior Value compares a measured value with the previously measured value. Confidence intervals were not taken into account in determining the direction of the comparison.

Health Insurance Spending-to-Income Ratio Census Tract: 06017031200

Current Value:

Health Insurance Spending-to-Income Ratio Census Tract: 06017031200

6.4%
(2023)
Compared to:
Compared to CA Census Tracts, 06017031200 has a value of 6.4% which is in the worst 25% of census tracts. Census tracts in the best 50% have a value lower than 4.9% while census tracts in the worst 25% have a value higher than 5.9%.
CA Census Tracts
The distribution is based on data from 9,086 California census tracts.
Compared to U.S. Census Tracts, 06017031200 has a value of 6.4% which is in the 2nd worst quartile of census tracts. Census tracts in the best 50% have a value lower than 6.3% while census tracts in the worst 25% have a value higher than 7.6%.
U.S. Census Tracts
The distribution is based on data from 83,789 U.S. census tracts.
Compared to the El Dorado, CA County Value (5.5%), 06017031200 has a value of 6.4% which is higher and worse.
El Dorado, CA County Value
(5.5%)
The regional value is compared to the El Dorado County value.
Compared to the prior value, 06017031200 (6.4%) is less and better than the previously measured value (6.7%).
Prior Value
(6.7%)
Prior Value compares a measured value with the previously measured value. Confidence intervals were not taken into account in determining the direction of the comparison.

Health Insurance Spending-to-Income Ratio Census Tract: 06017031301

Current Value:

Health Insurance Spending-to-Income Ratio Census Tract: 06017031301

5.6%
(2023)
Compared to:
Compared to CA Census Tracts, 06017031301 has a value of 5.6% which is in the 2nd worst quartile of census tracts. Census tracts in the best 50% have a value lower than 4.9% while census tracts in the worst 25% have a value higher than 5.9%.
CA Census Tracts
The distribution is based on data from 9,086 California census tracts.
Compared to U.S. Census Tracts, 06017031301 has a value of 5.6% which is in the best 50% of census tracts. Census tracts in the best 50% have a value lower than 6.3% while census tracts in the worst 25% have a value higher than 7.6%.
U.S. Census Tracts
The distribution is based on data from 83,789 U.S. census tracts.
Compared to the El Dorado, CA County Value (5.5%), 06017031301 has a value of 5.6% which is higher and worse.
El Dorado, CA County Value
(5.5%)
The regional value is compared to the El Dorado County value.
Compared to the prior value, 06017031301 (5.6%) is less and better than the previously measured value (5.7%).
Prior Value
(5.7%)
Prior Value compares a measured value with the previously measured value. Confidence intervals were not taken into account in determining the direction of the comparison.

Health Insurance Spending-to-Income Ratio Census Tract: 06017031302

Current Value:

Health Insurance Spending-to-Income Ratio Census Tract: 06017031302

9.1%
(2023)
Compared to:
Compared to CA Census Tracts, 06017031302 has a value of 9.1% which is in the worst 25% of census tracts. Census tracts in the best 50% have a value lower than 4.9% while census tracts in the worst 25% have a value higher than 5.9%.
CA Census Tracts
The distribution is based on data from 9,086 California census tracts.
Compared to U.S. Census Tracts, 06017031302 has a value of 9.1% which is in the worst 25% of census tracts. Census tracts in the best 50% have a value lower than 6.3% while census tracts in the worst 25% have a value higher than 7.6%.
U.S. Census Tracts
The distribution is based on data from 83,789 U.S. census tracts.
Compared to the El Dorado, CA County Value (5.5%), 06017031302 has a value of 9.1% which is higher and worse.
El Dorado, CA County Value
(5.5%)
The regional value is compared to the El Dorado County value.
Compared to the prior value, 06017031302 (9.1%) is greater and worse than the previously measured value (6.9%).
Prior Value
(6.9%)
Prior Value compares a measured value with the previously measured value. Confidence intervals were not taken into account in determining the direction of the comparison.

Health Insurance Spending-to-Income Ratio Census Tract: 06017031402

Current Value:

Health Insurance Spending-to-Income Ratio Census Tract: 06017031402

7.7%
(2022)
Compared to:
Compared to CA Census Tracts, 06017031402 has a value of 7.7% which is in the worst 25% of census tracts. Census tracts in the best 50% have a value lower than 4.9% while census tracts in the worst 25% have a value higher than 5.9%.
CA Census Tracts
The distribution is based on data from 8,008 California census tracts.
Compared to U.S. Census Tracts, 06017031402 has a value of 7.7% which is in the 2nd worst quartile of census tracts. Census tracts in the best 50% have a value lower than 6.5% while census tracts in the worst 25% have a value higher than 7.8%.
U.S. Census Tracts
The distribution is based on data from 72,424 U.S. census tracts.
Compared to the El Dorado, CA County Value (5.6%), 06017031402 has a value of 7.7% which is higher and worse.
El Dorado, CA County Value
(5.6%)
The regional value is compared to the El Dorado County value.

Health Insurance Spending-to-Income Ratio Census Tract: 06017031404

Current Value:

Health Insurance Spending-to-Income Ratio Census Tract: 06017031404

6.1%
(2023)
Compared to:
Compared to CA Census Tracts, 06017031404 has a value of 6.1% which is in the worst 25% of census tracts. Census tracts in the best 50% have a value lower than 4.9% while census tracts in the worst 25% have a value higher than 5.9%.
CA Census Tracts
The distribution is based on data from 9,086 California census tracts.
Compared to U.S. Census Tracts, 06017031404 has a value of 6.1% which is in the best 50% of census tracts. Census tracts in the best 50% have a value lower than 6.3% while census tracts in the worst 25% have a value higher than 7.6%.
U.S. Census Tracts
The distribution is based on data from 83,789 U.S. census tracts.
Compared to the El Dorado, CA County Value (5.5%), 06017031404 has a value of 6.1% which is higher and worse.
El Dorado, CA County Value
(5.5%)
The regional value is compared to the El Dorado County value.
Compared to the prior value, 06017031404 (6.1%) is less and better than the previously measured value (6.2%).
Prior Value
(6.2%)
Prior Value compares a measured value with the previously measured value. Confidence intervals were not taken into account in determining the direction of the comparison.

Health Insurance Spending-to-Income Ratio Census Tract: 06017031405

Current Value:

Health Insurance Spending-to-Income Ratio Census Tract: 06017031405

6.7%
(2023)
Compared to:
Compared to CA Census Tracts, 06017031405 has a value of 6.7% which is in the worst 25% of census tracts. Census tracts in the best 50% have a value lower than 4.9% while census tracts in the worst 25% have a value higher than 5.9%.
CA Census Tracts
The distribution is based on data from 9,086 California census tracts.
Compared to U.S. Census Tracts, 06017031405 has a value of 6.7% which is in the 2nd worst quartile of census tracts. Census tracts in the best 50% have a value lower than 6.3% while census tracts in the worst 25% have a value higher than 7.6%.
U.S. Census Tracts
The distribution is based on data from 83,789 U.S. census tracts.
Compared to the El Dorado, CA County Value (5.5%), 06017031405 has a value of 6.7% which is higher and worse.
El Dorado, CA County Value
(5.5%)
The regional value is compared to the El Dorado County value.
Compared to the prior value, 06017031405 (6.7%) is greater and worse than the previously measured value (6.0%).
Prior Value
(6.0%)
Prior Value compares a measured value with the previously measured value. Confidence intervals were not taken into account in determining the direction of the comparison.

Health Insurance Spending-to-Income Ratio Census Tract: 06017031406

Current Value:

Health Insurance Spending-to-Income Ratio Census Tract: 06017031406

5.8%
(2023)
Compared to:
Compared to CA Census Tracts, 06017031406 has a value of 5.8% which is in the 2nd worst quartile of census tracts. Census tracts in the best 50% have a value lower than 4.9% while census tracts in the worst 25% have a value higher than 5.9%.
CA Census Tracts
The distribution is based on data from 9,086 California census tracts.
Compared to U.S. Census Tracts, 06017031406 has a value of 5.8% which is in the best 50% of census tracts. Census tracts in the best 50% have a value lower than 6.3% while census tracts in the worst 25% have a value higher than 7.6%.
U.S. Census Tracts
The distribution is based on data from 83,789 U.S. census tracts.
Compared to the El Dorado, CA County Value (5.5%), 06017031406 has a value of 5.8% which is higher and worse.
El Dorado, CA County Value
(5.5%)
The regional value is compared to the El Dorado County value.
Compared to the prior value, 06017031406 (5.8%) is less and better than the previously measured value (6.3%).
Prior Value
(6.3%)
Prior Value compares a measured value with the previously measured value. Confidence intervals were not taken into account in determining the direction of the comparison.

Health Insurance Spending-to-Income Ratio Census Tract: 06017031407

Current Value:

Health Insurance Spending-to-Income Ratio Census Tract: 06017031407

7.4%
(2023)
Compared to:
Compared to CA Census Tracts, 06017031407 has a value of 7.4% which is in the worst 25% of census tracts. Census tracts in the best 50% have a value lower than 4.9% while census tracts in the worst 25% have a value higher than 5.9%.
CA Census Tracts
The distribution is based on data from 9,086 California census tracts.
Compared to U.S. Census Tracts, 06017031407 has a value of 7.4% which is in the 2nd worst quartile of census tracts. Census tracts in the best 50% have a value lower than 6.3% while census tracts in the worst 25% have a value higher than 7.6%.
U.S. Census Tracts
The distribution is based on data from 83,789 U.S. census tracts.
Compared to the El Dorado, CA County Value (5.5%), 06017031407 has a value of 7.4% which is higher and worse.
El Dorado, CA County Value
(5.5%)
The regional value is compared to the El Dorado County value.

Health Insurance Spending-to-Income Ratio Census Tract: 06017031408

Current Value:

Health Insurance Spending-to-Income Ratio Census Tract: 06017031408

5.5%
(2023)
Compared to:
Compared to CA Census Tracts, 06017031408 has a value of 5.5% which is in the 2nd worst quartile of census tracts. Census tracts in the best 50% have a value lower than 4.9% while census tracts in the worst 25% have a value higher than 5.9%.
CA Census Tracts
The distribution is based on data from 9,086 California census tracts.
Compared to U.S. Census Tracts, 06017031408 has a value of 5.5% which is in the best 50% of census tracts. Census tracts in the best 50% have a value lower than 6.3% while census tracts in the worst 25% have a value higher than 7.6%.
U.S. Census Tracts
The distribution is based on data from 83,789 U.S. census tracts.
Compared to the El Dorado, CA County Value (5.5%), 06017031408 has a value of 5.5%.
El Dorado, CA County Value
(5.5%)
The regional value is compared to the El Dorado County value.

Health Insurance Spending-to-Income Ratio Census Tract: 06017031409

Current Value:

Health Insurance Spending-to-Income Ratio Census Tract: 06017031409

8.5%
(2023)
Compared to:
Compared to CA Census Tracts, 06017031409 has a value of 8.5% which is in the worst 25% of census tracts. Census tracts in the best 50% have a value lower than 4.9% while census tracts in the worst 25% have a value higher than 5.9%.
CA Census Tracts
The distribution is based on data from 9,086 California census tracts.
Compared to U.S. Census Tracts, 06017031409 has a value of 8.5% which is in the worst 25% of census tracts. Census tracts in the best 50% have a value lower than 6.3% while census tracts in the worst 25% have a value higher than 7.6%.
U.S. Census Tracts
The distribution is based on data from 83,789 U.S. census tracts.
Compared to the El Dorado, CA County Value (5.5%), 06017031409 has a value of 8.5% which is higher and worse.
El Dorado, CA County Value
(5.5%)
The regional value is compared to the El Dorado County value.

Health Insurance Spending-to-Income Ratio Census Tract: 06017031502

Current Value:

Health Insurance Spending-to-Income Ratio Census Tract: 06017031502

6.6%
(2022)
Compared to:
Compared to CA Census Tracts, 06017031502 has a value of 6.6% which is in the worst 25% of census tracts. Census tracts in the best 50% have a value lower than 4.9% while census tracts in the worst 25% have a value higher than 5.9%.
CA Census Tracts
The distribution is based on data from 8,008 California census tracts.
Compared to U.S. Census Tracts, 06017031502 has a value of 6.6% which is in the 2nd worst quartile of census tracts. Census tracts in the best 50% have a value lower than 6.5% while census tracts in the worst 25% have a value higher than 7.8%.
U.S. Census Tracts
The distribution is based on data from 72,424 U.S. census tracts.
Compared to the El Dorado, CA County Value (5.6%), 06017031502 has a value of 6.6% which is higher and worse.
El Dorado, CA County Value
(5.6%)
The regional value is compared to the El Dorado County value.

Health Insurance Spending-to-Income Ratio Census Tract: 06017031503

Current Value:

Health Insurance Spending-to-Income Ratio Census Tract: 06017031503

6.0%
(2023)
Compared to:
Compared to CA Census Tracts, 06017031503 has a value of 6.0% which is in the worst 25% of census tracts. Census tracts in the best 50% have a value lower than 4.9% while census tracts in the worst 25% have a value higher than 5.9%.
CA Census Tracts
The distribution is based on data from 9,086 California census tracts.
Compared to U.S. Census Tracts, 06017031503 has a value of 6.0% which is in the best 50% of census tracts. Census tracts in the best 50% have a value lower than 6.3% while census tracts in the worst 25% have a value higher than 7.6%.
U.S. Census Tracts
The distribution is based on data from 83,789 U.S. census tracts.
Compared to the El Dorado, CA County Value (5.5%), 06017031503 has a value of 6.0% which is higher and worse.
El Dorado, CA County Value
(5.5%)
The regional value is compared to the El Dorado County value.
Compared to the prior value, 06017031503 (6.0%) is less and better than the previously measured value (6.3%).
Prior Value
(6.3%)
Prior Value compares a measured value with the previously measured value. Confidence intervals were not taken into account in determining the direction of the comparison.

Health Insurance Spending-to-Income Ratio Census Tract: 06017031504

Current Value:

Health Insurance Spending-to-Income Ratio Census Tract: 06017031504

7.7%
(2023)
Compared to:
Compared to CA Census Tracts, 06017031504 has a value of 7.7% which is in the worst 25% of census tracts. Census tracts in the best 50% have a value lower than 4.9% while census tracts in the worst 25% have a value higher than 5.9%.
CA Census Tracts
The distribution is based on data from 9,086 California census tracts.
Compared to U.S. Census Tracts, 06017031504 has a value of 7.7% which is in the worst 25% of census tracts. Census tracts in the best 50% have a value lower than 6.3% while census tracts in the worst 25% have a value higher than 7.6%.
U.S. Census Tracts
The distribution is based on data from 83,789 U.S. census tracts.
Compared to the El Dorado, CA County Value (5.5%), 06017031504 has a value of 7.7% which is higher and worse.
El Dorado, CA County Value
(5.5%)
The regional value is compared to the El Dorado County value.
Compared to the prior value, 06017031504 (7.7%) is greater and worse than the previously measured value (6.8%).
Prior Value
(6.8%)
Prior Value compares a measured value with the previously measured value. Confidence intervals were not taken into account in determining the direction of the comparison.

Health Insurance Spending-to-Income Ratio Census Tract: 06017031505

Current Value:

Health Insurance Spending-to-Income Ratio Census Tract: 06017031505

7.0%
(2023)
Compared to:
Compared to CA Census Tracts, 06017031505 has a value of 7.0% which is in the worst 25% of census tracts. Census tracts in the best 50% have a value lower than 4.9% while census tracts in the worst 25% have a value higher than 5.9%.
CA Census Tracts
The distribution is based on data from 9,086 California census tracts.
Compared to U.S. Census Tracts, 06017031505 has a value of 7.0% which is in the 2nd worst quartile of census tracts. Census tracts in the best 50% have a value lower than 6.3% while census tracts in the worst 25% have a value higher than 7.6%.
U.S. Census Tracts
The distribution is based on data from 83,789 U.S. census tracts.
Compared to the El Dorado, CA County Value (5.5%), 06017031505 has a value of 7.0% which is higher and worse.
El Dorado, CA County Value
(5.5%)
The regional value is compared to the El Dorado County value.

Health Insurance Spending-to-Income Ratio Census Tract: 06017031506

Current Value:

Health Insurance Spending-to-Income Ratio Census Tract: 06017031506

6.5%
(2023)
Compared to:
Compared to CA Census Tracts, 06017031506 has a value of 6.5% which is in the worst 25% of census tracts. Census tracts in the best 50% have a value lower than 4.9% while census tracts in the worst 25% have a value higher than 5.9%.
CA Census Tracts
The distribution is based on data from 9,086 California census tracts.
Compared to U.S. Census Tracts, 06017031506 has a value of 6.5% which is in the 2nd worst quartile of census tracts. Census tracts in the best 50% have a value lower than 6.3% while census tracts in the worst 25% have a value higher than 7.6%.
U.S. Census Tracts
The distribution is based on data from 83,789 U.S. census tracts.
Compared to the El Dorado, CA County Value (5.5%), 06017031506 has a value of 6.5% which is higher and worse.
El Dorado, CA County Value
(5.5%)
The regional value is compared to the El Dorado County value.

Health Insurance Spending-to-Income Ratio Census Tract: 06017031600

Current Value:

Health Insurance Spending-to-Income Ratio Census Tract: 06017031600

7.4%
(2022)
Compared to:
Compared to CA Census Tracts, 06017031600 has a value of 7.4% which is in the worst 25% of census tracts. Census tracts in the best 50% have a value lower than 4.9% while census tracts in the worst 25% have a value higher than 5.9%.
CA Census Tracts
The distribution is based on data from 8,008 California census tracts.
Compared to U.S. Census Tracts, 06017031600 has a value of 7.4% which is in the 2nd worst quartile of census tracts. Census tracts in the best 50% have a value lower than 6.5% while census tracts in the worst 25% have a value higher than 7.8%.
U.S. Census Tracts
The distribution is based on data from 72,424 U.S. census tracts.
Compared to the El Dorado, CA County Value (5.6%), 06017031600 has a value of 7.4% which is higher and worse.
El Dorado, CA County Value
(5.6%)
The regional value is compared to the El Dorado County value.

Health Insurance Spending-to-Income Ratio Census Tract: 06017031601

Current Value:

Health Insurance Spending-to-Income Ratio Census Tract: 06017031601

6.2%
(2023)
Compared to:
Compared to CA Census Tracts, 06017031601 has a value of 6.2% which is in the worst 25% of census tracts. Census tracts in the best 50% have a value lower than 4.9% while census tracts in the worst 25% have a value higher than 5.9%.
CA Census Tracts
The distribution is based on data from 9,086 California census tracts.
Compared to U.S. Census Tracts, 06017031601 has a value of 6.2% which is in the best 50% of census tracts. Census tracts in the best 50% have a value lower than 6.3% while census tracts in the worst 25% have a value higher than 7.6%.
U.S. Census Tracts
The distribution is based on data from 83,789 U.S. census tracts.
Compared to the El Dorado, CA County Value (5.5%), 06017031601 has a value of 6.2% which is higher and worse.
El Dorado, CA County Value
(5.5%)
The regional value is compared to the El Dorado County value.

Health Insurance Spending-to-Income Ratio Census Tract: 06017031602

Current Value:

Health Insurance Spending-to-Income Ratio Census Tract: 06017031602

6.2%
(2023)
Compared to:
Compared to CA Census Tracts, 06017031602 has a value of 6.2% which is in the worst 25% of census tracts. Census tracts in the best 50% have a value lower than 4.9% while census tracts in the worst 25% have a value higher than 5.9%.
CA Census Tracts
The distribution is based on data from 9,086 California census tracts.
Compared to U.S. Census Tracts, 06017031602 has a value of 6.2% which is in the best 50% of census tracts. Census tracts in the best 50% have a value lower than 6.3% while census tracts in the worst 25% have a value higher than 7.6%.
U.S. Census Tracts
The distribution is based on data from 83,789 U.S. census tracts.
Compared to the El Dorado, CA County Value (5.5%), 06017031602 has a value of 6.2% which is higher and worse.
El Dorado, CA County Value
(5.5%)
The regional value is compared to the El Dorado County value.

Health Insurance Spending-to-Income Ratio Census Tract: 06017031700

Current Value:

Health Insurance Spending-to-Income Ratio Census Tract: 06017031700

4.1%
(2023)
Compared to:
Compared to CA Census Tracts, 06017031700 has a value of 4.1% which is in the best 50% of census tracts. Census tracts in the best 50% have a value lower than 4.9% while census tracts in the worst 25% have a value higher than 5.9%.
CA Census Tracts
The distribution is based on data from 9,086 California census tracts.
Compared to U.S. Census Tracts, 06017031700 has a value of 4.1% which is in the best 50% of census tracts. Census tracts in the best 50% have a value lower than 6.3% while census tracts in the worst 25% have a value higher than 7.6%.
U.S. Census Tracts
The distribution is based on data from 83,789 U.S. census tracts.
Compared to the El Dorado, CA County Value (5.5%), 06017031700 has a value of 4.1% which is lower and better.
El Dorado, CA County Value
(5.5%)
The regional value is compared to the El Dorado County value.
Compared to the prior value, 06017031700 (4.1%) is greater and worse than the previously measured value (3.9%).
Prior Value
(3.9%)
Prior Value compares a measured value with the previously measured value. Confidence intervals were not taken into account in determining the direction of the comparison.

Health Insurance Spending-to-Income Ratio Census Tract: 06017031800

Current Value:

Health Insurance Spending-to-Income Ratio Census Tract: 06017031800

3.8%
(2023)
Compared to:
Compared to CA Census Tracts, 06017031800 has a value of 3.8% which is in the best 50% of census tracts. Census tracts in the best 50% have a value lower than 4.9% while census tracts in the worst 25% have a value higher than 5.9%.
CA Census Tracts
The distribution is based on data from 9,086 California census tracts.
Compared to U.S. Census Tracts, 06017031800 has a value of 3.8% which is in the best 50% of census tracts. Census tracts in the best 50% have a value lower than 6.3% while census tracts in the worst 25% have a value higher than 7.6%.
U.S. Census Tracts
The distribution is based on data from 83,789 U.S. census tracts.
Compared to the El Dorado, CA County Value (5.5%), 06017031800 has a value of 3.8% which is lower and better.
El Dorado, CA County Value
(5.5%)
The regional value is compared to the El Dorado County value.
Compared to the prior value, 06017031800 (3.8%) is greater and worse than the previously measured value (3.7%).
Prior Value
(3.7%)
Prior Value compares a measured value with the previously measured value. Confidence intervals were not taken into account in determining the direction of the comparison.

Health Insurance Spending-to-Income Ratio Census Tract: 06017031900

Current Value:

Health Insurance Spending-to-Income Ratio Census Tract: 06017031900

7.9%
(2023)
Compared to:
Compared to CA Census Tracts, 06017031900 has a value of 7.9% which is in the worst 25% of census tracts. Census tracts in the best 50% have a value lower than 4.9% while census tracts in the worst 25% have a value higher than 5.9%.
CA Census Tracts
The distribution is based on data from 9,086 California census tracts.
Compared to U.S. Census Tracts, 06017031900 has a value of 7.9% which is in the worst 25% of census tracts. Census tracts in the best 50% have a value lower than 6.3% while census tracts in the worst 25% have a value higher than 7.6%.
U.S. Census Tracts
The distribution is based on data from 83,789 U.S. census tracts.
Compared to the El Dorado, CA County Value (5.5%), 06017031900 has a value of 7.9% which is higher and worse.
El Dorado, CA County Value
(5.5%)
The regional value is compared to the El Dorado County value.
Compared to the prior value, 06017031900 (7.9%) is greater and worse than the previously measured value (7.2%).
Prior Value
(7.2%)
Prior Value compares a measured value with the previously measured value. Confidence intervals were not taken into account in determining the direction of the comparison.

Health Insurance Spending-to-Income Ratio Census Tract: 06017032000

Current Value:

Health Insurance Spending-to-Income Ratio Census Tract: 06017032000

6.4%
(2022)
Compared to:
Compared to CA Census Tracts, 06017032000 has a value of 6.4% which is in the worst 25% of census tracts. Census tracts in the best 50% have a value lower than 4.9% while census tracts in the worst 25% have a value higher than 5.9%.
CA Census Tracts
The distribution is based on data from 8,008 California census tracts.
Compared to U.S. Census Tracts, 06017032000 has a value of 6.4% which is in the best 50% of census tracts. Census tracts in the best 50% have a value lower than 6.5% while census tracts in the worst 25% have a value higher than 7.8%.
U.S. Census Tracts
The distribution is based on data from 72,424 U.S. census tracts.
Compared to the El Dorado, CA County Value (5.6%), 06017032000 has a value of 6.4% which is higher and worse.
El Dorado, CA County Value
(5.6%)
The regional value is compared to the El Dorado County value.

Health Insurance Spending-to-Income Ratio Census Tract: 06017032001

Current Value:

Health Insurance Spending-to-Income Ratio Census Tract: 06017032001

6.0%
(2023)
Compared to:
Compared to CA Census Tracts, 06017032001 has a value of 6.0% which is in the worst 25% of census tracts. Census tracts in the best 50% have a value lower than 4.9% while census tracts in the worst 25% have a value higher than 5.9%.
CA Census Tracts
The distribution is based on data from 9,086 California census tracts.
Compared to U.S. Census Tracts, 06017032001 has a value of 6.0% which is in the best 50% of census tracts. Census tracts in the best 50% have a value lower than 6.3% while census tracts in the worst 25% have a value higher than 7.6%.
U.S. Census Tracts
The distribution is based on data from 83,789 U.S. census tracts.
Compared to the El Dorado, CA County Value (5.5%), 06017032001 has a value of 6.0% which is higher and worse.
El Dorado, CA County Value
(5.5%)
The regional value is compared to the El Dorado County value.

Health Insurance Spending-to-Income Ratio Census Tract: 06017032002

Current Value:

Health Insurance Spending-to-Income Ratio Census Tract: 06017032002

7.5%
(2023)
Compared to:
Compared to CA Census Tracts, 06017032002 has a value of 7.5% which is in the worst 25% of census tracts. Census tracts in the best 50% have a value lower than 4.9% while census tracts in the worst 25% have a value higher than 5.9%.
CA Census Tracts
The distribution is based on data from 9,086 California census tracts.
Compared to U.S. Census Tracts, 06017032002 has a value of 7.5% which is in the 2nd worst quartile of census tracts. Census tracts in the best 50% have a value lower than 6.3% while census tracts in the worst 25% have a value higher than 7.6%.
U.S. Census Tracts
The distribution is based on data from 83,789 U.S. census tracts.
Compared to the El Dorado, CA County Value (5.5%), 06017032002 has a value of 7.5% which is higher and worse.
El Dorado, CA County Value
(5.5%)
The regional value is compared to the El Dorado County value.

Health / Health Care Access & Quality

Mental Health Provider Rate

Value
Compared to:

Health / Health Care Access & Quality

Mental Health Provider Rate

Value
Compared to:

Mental Health Provider Rate County: El Dorado

Current Value:

Mental Health Provider Rate County: El Dorado

425
Providers per 100,000 population
(2023)
Compared to:
Compared to CA Counties, El Dorado has a value of 425 which is in the best 50% of counties. Counties in the best 50%  have a value higher than 401 while counties in the worst 25% have a value lower than 259.
CA Counties
The distribution is based on data from 58 California counties.
Compared to U.S. Counties, El Dorado has a value of 425 which is in the best 50% of counties. Counties in the best 50%  have a value higher than 137 while counties in the worst 25% have a value lower than 62.
U.S. Counties
The distribution is based on data from 2,956 U.S. counties and county equivalents.
Compared to the CA Value (450), El Dorado has a value of 425 which is lower and worse.
CA Value
(450)
The regional value is compared to the California state value.
Compared to the prior value, El Dorado (425) is greater and better than the previously measured value (398).
Prior Value
(398)
Prior Value compares a measured value with the previously measured value. Confidence intervals were not taken into account in determining the direction of the comparison.
Over time, the El Dorado value is increasing significantly.
Trend
This comparison measures the indicator’s values over multiple time periods.<br>The Mann-Kendall Test for Statistical Significance is used to evaluate the trend<br>over 4 to 10 periods of measure, subject to data availability and comparability.

Health / Health Care Access & Quality

Non-Physician Primary Care Provider Rate

Value
Compared to:

Health / Health Care Access & Quality

Non-Physician Primary Care Provider Rate

Value
Compared to:

Non-Physician Primary Care Provider Rate County: El Dorado

Current Value:

Non-Physician Primary Care Provider Rate County: El Dorado

58
Providers per 100,000 population
(2023)
Compared to:
Compared to CA Counties, El Dorado has a value of 58 which is in the worst 25% of counties. Counties in the best 50%  have a value higher than 86 while counties in the worst 25% have a value lower than 67.
CA Counties
The distribution is based on data from 58 California counties.
Compared to U.S. Counties, El Dorado has a value of 58 which is in the worst 25% of counties. Counties in the best 50%  have a value higher than 94 while counties in the worst 25% have a value lower than 65.
U.S. Counties
The distribution is based on data from 3,129 U.S. counties and county equivalents.
Compared to the CA Value (87), El Dorado has a value of 58 which is lower and worse.
CA Value
(87)
The regional value is compared to the California state value.
Compared to the prior value, El Dorado (58) is less and worse than the previously measured value (59).
Prior Value
(59)
Prior Value compares a measured value with the previously measured value. Confidence intervals were not taken into account in determining the direction of the comparison.
Over time, the El Dorado value is increasing significantly.
Trend
This comparison measures the indicator’s values over multiple time periods.<br>The Mann-Kendall Test for Statistical Significance is used to evaluate the trend<br>over 4 to 10 periods of measure, subject to data availability and comparability.

Health / Health Care Access & Quality

People Delayed or had Difficulty Obtaining Care

Value
Compared to:

Health / Health Care Access & Quality

People Delayed or had Difficulty Obtaining Care

Value
Compared to:

People Delayed or had Difficulty Obtaining Care County: El Dorado

Current Value:

People Delayed or had Difficulty Obtaining Care County: El Dorado

19.7%
(2021-2022)
Compared to:
Compared to CA Counties, El Dorado has a value of 19.7% which is in the worst 25% of counties. Counties in the best 50% have a value lower than 17.5% while counties in the worst 25% have a value higher than 19.2%.
CA Counties
The distribution is based on data from 58 California counties.
Compared to the CA Value (16.5%), El Dorado has a value of 19.7% which is higher and worse.
CA Value
(16.5%)
The regional value is compared to the California state value.
Compared to the prior value, El Dorado (19.7%) is not statistically different from the previously measured value (18.1%).
Prior Value
(18.1%)
Prior Value compares a measured value with the previously measured value. Confidence intervals were taken into account in determining the direction of the comparison.
Over time, the El Dorado value is increasing, not significantly.
Trend
This comparison measures the indicator’s values over multiple time periods.<br>The Mann-Kendall Test for Statistical Significance is used to evaluate the trend<br>over 4 to 10 periods of measure, subject to data availability and comparability.
Compared to the HP 2030 Target (5.9%), the target has not been met.
HP 2030 Target
(5.9%)

Health / Health Care Access & Quality

People with a Usual Source of Health Care

Value
Compared to:

Health / Health Care Access & Quality

People with a Usual Source of Health Care

Value
Compared to:

People with a Usual Source of Health Care County: El Dorado

Current Value:

People with a Usual Source of Health Care County: El Dorado

89.1%
(2022)
Compared to:
Compared to CA Counties, El Dorado has a value of 89.1% which is in the best 50% of counties. Counties in the best 50%  have a value higher than 84.4% while counties in the worst 25% have a value lower than 81.3%.
CA Counties
The distribution is based on data from 58 California counties.
Compared to the CA Value (82.5%), El Dorado has a value of 89.1% which is higher and better.
CA Value
(82.5%)
The regional value is compared to the California state value.
Compared to the prior value, El Dorado (89.1%) is not statistically different from the previously measured value (88.8%).
Prior Value
(88.8%)
Prior Value compares a measured value with the previously measured value. Confidence intervals were taken into account in determining the direction of the comparison.
Over time, the El Dorado value is decreasing, not significantly.
Trend
This comparison measures the indicator’s values over multiple time periods.<br>The Mann-Kendall Test for Statistical Significance is used to evaluate the trend<br>over 4 to 10 periods of measure, subject to data availability and comparability.

Health / Health Care Access & Quality

Persons with Health Insurance

Value
Compared to:

Health / Health Care Access & Quality

Persons with Health Insurance

Value
Compared to:

Persons with Health Insurance County: El Dorado

Current Value:

Persons with Health Insurance County: El Dorado

95.2%
(2021)
Compared to:
Compared to CA Counties, El Dorado has a value of 95.2% which is in the best 50% of counties. Counties in the best 50%  have a value higher than 92.4% while counties in the worst 25% have a value lower than 91.0%.
CA Counties
The distribution is based on data from 58 California counties.
Compared to U.S. Counties, El Dorado has a value of 95.2% which is in the best 50% of counties. Counties in the best 50%  have a value higher than 89.6% while counties in the worst 25% have a value lower than 85.4%.
U.S. Counties
The distribution is based on data from 3,140 U.S. counties and county equivalents.
Compared to the CA Value (91.9%), El Dorado has a value of 95.2% which is higher and better.
CA Value
(91.9%)
The regional value is compared to the California state value.
Compared to the prior value, El Dorado (95.2%) is not statistically different from the previously measured value (94.6%).
Prior Value
(94.6%)
Prior Value compares a measured value with the previously measured value. Confidence intervals were taken into account in determining the direction of the comparison.
Over time, the El Dorado value is increasing, not significantly.
Trend
This comparison measures the indicator’s values over multiple time periods.<br>The Mann-Kendall Test for Statistical Significance is used to evaluate the trend<br>over 4 to 10 periods of measure, subject to data availability and comparability.
Compared to the HP 2030 Target (92.4%), the target has  been met.
HP 2030 Target
(92.4%)
<div>AHS-01: Increase the proportion of people with health insurance <strong>(LEADING HEALTH INDICATOR)</strong></div>

Health / Health Care Access & Quality

Persons with Private Health Insurance Only

Value
Compared to:

Health / Health Care Access & Quality

Persons with Private Health Insurance Only

Value
Compared to:

Persons with Private Health Insurance Only County: El Dorado

Current Value:

Persons with Private Health Insurance Only County: El Dorado

57.8%
(2022)
Compared to:
Compared to the CA Value (53.5%), El Dorado has a value of 57.8%.
CA Value
(53.5%)
The regional value is compared to the California state value.
Compared to the US Value (54.8%), El Dorado has a value of 57.8%.
US Value
(54.8%)
The regional value is compared to the national value.
Compared to the prior value, El Dorado (57.8%) is greater  than the previously measured value (57.0%).
Prior Value
(57.0%)
Prior Value compares a measured value with the previously measured value. Confidence intervals were not taken into account in determining the direction of the comparison.
Over time, the El Dorado value is decreasing, not significantly.
Trend
This comparison measures the indicator’s values over multiple time periods.<br>The Mann-Kendall Test for Statistical Significance is used to evaluate the trend<br>over 4 to 10 periods of measure, subject to data availability and comparability.

Health / Health Care Access & Quality

Persons with Public Health Insurance Only

Value
Compared to:

Health / Health Care Access & Quality

Persons with Public Health Insurance Only

Value
Compared to:

Persons with Public Health Insurance Only County: El Dorado

Current Value:

Persons with Public Health Insurance Only County: El Dorado

18.7%
(2022)
Compared to:
Compared to the CA Value (29.8%), El Dorado has a value of 18.7%.
CA Value
(29.8%)
The regional value is compared to the California state value.
Compared to the US Value (24.8%), El Dorado has a value of 18.7%.
US Value
(24.8%)
The regional value is compared to the national value.
Compared to the prior value, El Dorado (18.7%) is less  than the previously measured value (20.8%).
Prior Value
(20.8%)
Prior Value compares a measured value with the previously measured value. Confidence intervals were not taken into account in determining the direction of the comparison.
Over time, the El Dorado value is decreasing, not significantly.
Trend
This comparison measures the indicator’s values over multiple time periods.<br>The Mann-Kendall Test for Statistical Significance is used to evaluate the trend<br>over 4 to 10 periods of measure, subject to data availability and comparability.

Health / Health Care Access & Quality

Preventable Hospital Stays: Medicare Population

Value
Compared to:

Health / Health Care Access & Quality

Preventable Hospital Stays: Medicare Population

Value
Compared to:

Preventable Hospital Stays: Medicare Population County: El Dorado

Current Value:

Preventable Hospital Stays: Medicare Population County: El Dorado

2,043.0
Discharges per 100,000 Medicare enrollees
(2022)
Compared to:
Compared to CA Counties, El Dorado has a value of 2,043.0 which is in the best 50% of counties. Counties in the best 50% have a value lower than 2,111.5 while counties in the worst 25% have a value higher than 2,576.5.
CA Counties
The distribution is based on data from 58 California counties.
Compared to U.S. Counties, El Dorado has a value of 2,043.0 which is in the best 50% of counties. Counties in the best 50% have a value lower than 2,729.0 while counties in the worst 25% have a value higher than 3,374.5.
U.S. Counties
The distribution is based on data from 3,129 U.S. counties and county equivalents.
Compared to the CA Value (2,275.0), El Dorado has a value of 2,043.0 which is lower and better.
CA Value
(2,275.0)
The regional value is compared to the California state value.
Compared to the US Value (2,677.0), El Dorado has a value of 2,043.0 which is lower and better.
US Value
(2,677.0)
The regional value is compared to the national value.
Compared to the prior value, El Dorado (2,043.0) is greater and worse than the previously measured value (1,885.0).
Prior Value
(1,885.0)
Prior Value compares a measured value with the previously measured value. Confidence intervals were not taken into account in determining the direction of the comparison.
Over time, the El Dorado value is decreasing, significantly.
Trend
This comparison measures the indicator’s values over multiple time periods.<br>The Mann-Kendall Test for Statistical Significance is used to evaluate the trend<br>over 4 to 10 periods of measure, subject to data availability and comparability.

Health / Health Care Access & Quality

Primary Care Provider Rate

Value
Compared to:

Health / Health Care Access & Quality

Primary Care Provider Rate

Value
Compared to:

Primary Care Provider Rate County: El Dorado

Current Value:

Primary Care Provider Rate County: El Dorado

76
Providers per 100,000 population
(2021)
Compared to:
Compared to CA Counties, El Dorado has a value of 76 which is in the best 50% of counties. Counties in the best 50%  have a value higher than 68 while counties in the worst 25% have a value lower than 46.
CA Counties
The distribution is based on data from 57 California counties.
Compared to U.S. Counties, El Dorado has a value of 76 which is in the best 50% of counties. Counties in the best 50%  have a value higher than 47 while counties in the worst 25% have a value lower than 29.
U.S. Counties
The distribution is based on data from 2,984 U.S. counties and county equivalents.
Compared to the CA Value (81), El Dorado has a value of 76 which is lower and worse.
CA Value
(81)
The regional value is compared to the California state value.
Compared to the prior value, El Dorado (76) is less and worse than the previously measured value (79).
Prior Value
(79)
Prior Value compares a measured value with the previously measured value. Confidence intervals were not taken into account in determining the direction of the comparison.
Over time, the El Dorado value is increasing, not significantly.
Trend
This comparison measures the indicator’s values over multiple time periods.<br>The Mann-Kendall Test for Statistical Significance is used to evaluate the trend<br>over 4 to 10 periods of measure, subject to data availability and comparability.